All posts by Thornton Weather

ThorntonWeather.com is your local source for live Thornton, Colorado weather conditions and news!

January 18 to January 24: This week in Denver weather history

This Week In Denver Weather History
January 18 to January 24: This week in Denver weather history

Our look back in Denver weather history for this week is dominated by the seemingly ever present high winds this time of year.  There are numerous incidents of those causing damage and injury.  Also notable though was a snowstorm in 1948 that dumped snow for more than 92 hours straight, a protracted cold spell in 1962 that lasted nearly a week and claimed lives and more recently the snowstorms in January 2007 that dumped snow on the region.

From the National Weather Service:

14-21

In 1930…a protracted cold spell occurred when low temperatures plunged below zero on 8 consecutive days. The coldest low temperatures of 20 degrees below zero on the 17th and 19 degrees below zero on the 16th were record minimums for the dates. High temperatures during the period ranged from 18 on the 18th to zero on the 20th. Two degrees on the 15th was a record low maximum temperature for the date.

15-23

In 1962…a protracted cold spell kept metro Denver in the deep freeze for more than a week. From the 15th thru the 23rd…low temperatures were zero or below for 9 consecutive days…but a daily record low was set only on the 22nd when the temperature dipped to 14 degrees below zero. A record low maximum for the date was also set on the 22nd when the temperature climbed to only 11 degrees. The coldest high temperature was 3 degrees above zero on the 21st…which did not break the record. The protracted cold was broken for only a few hours on the afternoon of the 20th when Chinook winds warmed the temperature to a high of 38 degrees before another surge of cold arctic air plunged temperatures back into the deep freeze that evening. The severe cold caused much damage to water systems. A woman was frozen to death at Morrison. There were other deaths attributable to the weather…including traffic deaths and heart attacks from overexertion.

16-18

in 1943…light snowfall totaled 3.2 inches over the 3 days. This was the only measurable snow of the month. North winds were sustained to 20 mph on the 16th.

In 2011…very strong winds associated with an upper level jetstream over Colorado produced blizzard conditions in the mountains above timberline. Peak wind gusts included: 99 mph atop Loveland pass…94 mph…2 miles southwest of Mary Jane…80 mph atop Berthoud Pass and 79 mph atop Niwot Ridge. Storm totals in the ski areas west of Denver ranged from 8 to 14 inches.

17-18

In 1974…rare overnight January rainfall totaled 0.12 inch on the 17th and 0.26 inch on the 18th when it was briefly mixed with snow.

In 2012…damaging winds developed in and near the Front Range. In Boulder…the high winds knocked down several trees…power poles and electrical lines. Some of the fallen trees damaged homes and automobiles. A semi-trailer was blown on its side along State Highway 93 near Marshall. Peak wind gusts included: 104 mph in south Boulder; 98 mph…3 miles southwest of Pinecliffe; 95 mph…2 miles northwest of Rocky Flats; 92 mph…at State Highway 93 near Marshall; 87 mph at Berthoud Pass and in Boulder Canyon; 80 mph…5 miles west- northwest of Boulder; 83 mph at NCAR Mesa Lab; 78 mph…8 miles northeast of four corners; 79 mph at the National Wind Technology Center; 76 mph at Wondervu; 75 mph atop Loveland Pass and the NCAR foothills lab in Boulder; 74 mph at Blue Mountain…Boulder Municipal Airport…1 mile northwest of Lyons; 73 mph…4 miles east-northeast of Nederland; 72 mph at the junction of State Highways 72 and 93; 62 mph in Superior; and 61 mph at Erie Municipal Airport. A peak wind gust of 38 mph from the northwest was observed at Denver International Airport.

18

In 1874…light rain…rare in January…changed to snow which totaled 3 inches.

In 1959…strong gusty winds caused damage to buildings… Airplanes…trees…and a radio tower in Boulder… Broomfield…Denver…and Longmont. A wind gust to 70 mph was recorded in Longmont. In Boulder…the top of a radio tower was toppled and signs…trees…and trailer houses were blown over. In southwest Denver…a mother and child were injured when their car was struck by a sign that had blown loose in the wind. Minor damage to buildings and power lines was reported in the area. Northwest winds gusted to 38 mph at Stapleton Airport. Post-frontal east northeast winds gusted to 40 mph.

In 1961…northeast winds gusted to 29 mph and snowfall totaled only 0.1 inch at Stapleton Airport…but 2 to 7 inches of snow fell in the foothills west of Denver.

In 1975…a strong cold front roared through metro Denver producing north wind gusts to 52 mph and briefly reducing the visibility at Stapleton International Airport to less than 5/8 mile in blowing dust. The windstorm caused considerable damage to utility lines…homes…fences… Commercial buildings…autos…and schools. Heaviest damage was near the foothills where winds hit 80 mph at Boulder and at Rocky Flats northwest of Denver. The cold front caused temperatures to drop 13 degrees in one hour. Temperatures fell from a maximum of 61 degrees in the early afternoon to a minimum of 31 degrees before midnight.

In 1984…the coldest morning of the new year produced record breaking temperatures with a low of 19 degrees below zero for the date at Denver. Many other cities also reported record cold.

In 1985…highs winds occurred in the foothills with gusts reported to 60 mph at Evergreen. Northwest winds gusted to 38 mph at Stapleton International Airport.

In 1986…wind gusts to 60 mph were reported in Boulder. West winds gusted to 31 mph at Stapleton International Airport.

In 1999…damaging downslope winds caused problems in the foothills. In Eldora…the roof was blown off an a-frame house. Peak wind gusts included: 100 mph at central city…84 mph at Wondervu…77 mph atop Blue Mountain… 75 mph in Golden Gate Canyon…72 mph at the Rocky Flats Environmental Test Facility…and 70 mph at the National Center for Atmospheric Research Mesa Laboratory near Boulder. West winds gusted to 36 mph and warmed the temperature to a high of 63 degrees…the highest reading of the month at Denver International Airport.

In 2006…high winds occurred in northern Jefferson and southern Boulder counties. A peak wind gust to 81 mph was recorded near superior along with a gust to 80 mph near Boulder. Five teenagers started a grassfire near Plainview atop Rocky Flats. The high winds coupled with very dry conditions allowed the fire to quickly spread…forcing the evacuation of dozens of residents and the closure of State Highways 93 and 72. The fire consumed 2700 acres and destroyed two outbuildings. No homes were damaged and no one was injured by the blaze. West winds gusted to 30 mph at Denver International Airport.

Continue reading January 18 to January 24: This week in Denver weather history

Study: Mountain Monitoring System Artificially Inflates Temperature Increases at Higher Elevations

Warming mountain climate?  A new study raises serious questions about the accuracy of the data. (Tony's Takes)
Warming mountain climate? A new study raises serious questions about the accuracy of the data. (Tony’s Takes)

We have all heard the warnings about a warming climate and scientists have claimed to have the data to prove it.  However time and time again the very underlying data has been shown to be faulty.  Here we again find another case.

A new study from the University of Montana shows extreme warming bias in temperature data from critical networks.  The study takes a hard look at climate data gathered across the Rocky Mountain west, including here in Colorado.

“In the context of a warming climate, this artificial amplification of mountain climate trends has likely compromised our ability to accurately attribute climate change impacts across the mountainous western US,” author Jared Oyler writes in his study.

From the University of Montana:

January 12, 2015

MISSOULA – In a recent study, University of Montana and Montana Climate Office researcher Jared Oyler found that while the western U.S. has warmed, recently observed warming in the mountains of the western U.S. likely is not as large as previously supposed.

His results, published Jan. 9 in the journal Geophysical Research Letters, show that sensor changes have significantly biased temperature observations from the Snowpack Telemetry (SNOTEL) station network.

More than 700 SNOTEL sites monitor temperature and snowpack across the mountainous western U.S. SNOTEL provides critical data for water supply forecasts. Researchers often use SNOTEL data to study mountain climate trends and impacts to mountain hydrology and ecology.

Oyler and his co-authors applied statistical techniques to account for biases introduced when equipment was switched at SNOTEL sites in the mid-1990s to mid-2000s. His revised datasets reduced the biases to reveal that high-elevation minimum temperatures were warming only slightly more than minimum temperatures at lower elevations.

“Observations from other station networks clearly show that the western U.S. has experienced regional warming,” Oyler said, “but to assess current and future climate change impacts to snowpack and important mountain ecosystem processes, we need accurate observations from the high elevation areas only covered by the SNOTEL network. The SNOTEL bias has likely compromised our ability to understand the unique drivers and impacts of climate change in western U.S. mountains.”

Co-authors on the paper “Artificial Amplification of Warming Trends Across the Mountains of the Western United States” include UM researchers Solomon Dobrowski, Ashley Ballantyne, Anna Klene and Steve Running. It is available online at http://onlinelibrary.wiley.com/enhanced/doi/10.1002/2014GL062803/.

###

Contact: Jared Oyler, Montana Climate Office, 215-260-4487, jared.oyler@ntsg.umt.edu.

On the net:  Study: US Weather Stations Exaggerated Warming In Western Mountains

State of the Climate 2014: Warmer, wetter than normal in the U.S.

Significant U.S. Weather and Climate Events for 2014. Click for larger view.  (NOAA / NCDC)
Significant U.S. Weather and Climate Events for 2014. Click for larger view. (NOAA / NCDC)

The National Climatic Data Center (NCDC) has released its summary of the nation’s climate and weather for 2014.  Its analysis shows that overall, the United States experienced warmer than normal temperatures and above average precipitation.

From NOAA / NCDC:

2014 U.S. temperature exceeds 20th-century average for the 18th consecutive year

Second warmest December boosted 2014 to 34th warmest year for contiguous U.S; eight weather and climate disasters exceeded $1 billion in damages

The 2014 annual average contiguous U.S. temperature was 52.6°F, 0.5°F above the 20th century average. Very warm conditions dominated the West, with four states having their warmest year on record, while the Midwest and Mississippi Valley were cool. This ranked as the 34th warmest year since we began keeping track in the 1895, while the temperature exceeded the 20th Century average for the 18th consecutive year.

The average contiguous U.S. precipitation was 30.76 inches, 0.82 inch above average, and ranked as the 40th wettest year in the 120-year period of record. The Northern U.S. was wet, and the Southern Plains were dry; the national drought footprint shrank about 2 percent.

In 2014, there were eight weather/climate disaster events with losses exceeding $1 billion each across the United States. These eight events resulted in the deaths of 53 people. The events include: the western U.S. drought, the Michigan & Northeast flooding event, five severe storm events, and one winter storm event.

U.S. climate highlights: 2014

  • The West was warmer than average for much of 2014. Nine states had a top 10 warm year.Alaska, Arizona, California, and Nevada each had their warmest year on record. Most locations from the Rockies to the East Coast were cooler than average, with the exception of New England and Florida. Seven states across the Midwest and Mississippi River Valley had a top 10 cool year. No state was record cold during 2014.
  • The Pacific Northwest, Northern Rockies, Midwest, and Northeast were all wetter than average. Michigan and Wisconsin each had their seventh wettest year on record. The Southern Plains and parts of the Ohio Valley were drier than average, but no state was top 10 dry. The rest of the contiguous U.S. had near-average annual precipitation totals.
  • The U.S. Climate Extremes Index (USCEI) for 2014 was 35 percent above average, ranking as the 19th highest annual USCEI in the 105-year record. The components of the USCEI that were much above average for the year included warm nighttime temperatures and 1-day precipitation totals. The USCEI is an index that tracks extremes (falling in the upper or lower 10 percent of the record) in temperature, precipitation, drought, and land-falling tropical cyclones across the contiguous U.S.
Statewide Average Temperature Ranks for 2014. (NOAA / NCDC)
Statewide Average Precipitation Ranks for 2014. (NOAA / NCDC)

January 11 to January 17: This Week in Denver Weather History

This Week In Denver Weather History
January 10 to January 17: This Week in Denver Weather History

January is not usually particularly snowy and as our look back at this week in Denver weather history shows, it is wind and extreme cold that are the most notable conditions during the period.

From the National Weather Service:

10-11 in 1948…strong winds were reported in Boulder and Lakewood. Winds of 50 to 60 mph were reported at Valmont…just east of Boulder. Only minor damage was reported.

In 1980…strong winds of 60 to 95 mph howled across metro Denver…causing some brief power outages and some broken windows. A wind gust to 111 mph was recorded at Wondervu. Northwest winds gusted to 40 mph at Stapleton International Airport on the 10th.

In 1999…high winds gusting to 100 mph blasted the foothills. Peak wind gusts included: 100 mph at central city…98 mph at Wondervu…82 mph at Aspen Springs and Golden Gate Canyon… 81 mph at the NCAR Mesa Lab in Boulder and near Nederland… 78 mph atop Blue Mountain near Coal Creek Canyon…and 72 mph at the Rocky Flats Environmental Test Facility. West winds gusted to 38 mph and warmed the temperature to a high of 63 degrees at Denver International Airport on the 11th.

10-12

In 1997…heavy snow fell over the Front Range foothills. A foot of new snow was measured at Blackhawk with 7 inches recorded in Coal Creek Canyon. Only 3.3 inches of snow fell at the site of the former Stapleton International Airport. East-northeast winds gusted to 18 mph at Denver International Airport on the 11th.

10-13

In 1963…a arctic cold wave plunged temperatures well below zero across metro Denver. Temperatures were below zero for a total of 64 consecutive hours. Low temperatures reached 25 degrees below zero on both the 11th and 12th. The high temperature of 9 degrees below zero on the 11th was the coldest ever recorded at Stapleton Airport and equaled the record low maximum for the month first set on January 19…1883…in downtown Denver. The high temperature on the 12th reached only 1 degree below zero. On the 12th…an 18-year-old youth died of exposure from the extreme cold in Denver. There were many losses and damage to property from frozen water systems…stalled cars…and over-burdened heating systems. Light snow accompanied the arctic blast. At Stapleton Airport…2.3 inches of snow fell on the 10th and 11th.

11

In 1887…northwest winds were sustained to 40 mph in the city.

In 1893…northwest winds to 48 mph were recorded in the city.

In 1901…northwest winds were sustained to 45 mph with an extreme velocity of 47 mph.

In 1988…strong Chinook winds blew throughout the day along the eastern foothills. Winds peaked to 75 mph in Boulder… Breaking at least one window. West winds gusted to 49 mph at Stapleton International Airport.

In 1989…2 to 3 inches of snow fell across metro Denver causing near gridlock conditions during the morning rush hour and two-hour delays at Stapleton International Airport. Two to 6 inches of snow whitened Boulder where many traffic accidents were reported. Snowfall measured 2.9 inches at Stapleton International Airport where northeast winds gusted to 21 mph.

In 1995…high winds developed in the foothills. A gust to 67 mph was recorded at Rocky Flats in northern Jefferson County. West winds gusted to only 32 mph at Stapleton International Airport.

In 1996…very strong winds were reported in the Front Range foothills for a brief time. Wind gusts to 85 mph were recorded at Golden Gate Canyon…with 95 mph at Wondervu.

11-12

In 1972…high winds howled along the Front Range foothills. A wind gust to 144 mph was recorded at the National Center for Atmospheric Research in Boulder. A wind gust to 105 mph was recorded at the Rocky Flats plant south of Boulder. Wind gusts to 90 mph were recorded in downtown Boulder. The greatest damage from the windstorm occurred in Boulder where 25 or more mobile homes were destroyed either by wind or the fires which resulted when they were overturned. Car windows were blown out; many buildings damaged; utility poles…power lines…trees…and traffic lights blown down. As many as 75 families were evacuated from a recently completed apartment building because of severe structural damage. Government and private office buildings and industrial plants were evacuated because of danger from flying glass and debris. Twelve people were treated at the hospital…mostly for cuts from flying glass. At least 15 small planes were seriously damaged and hangar doors were blown off at the Jefferson County Airport in Broomfield. Wind damage in Boulder alone totaled 2 million dollars. At Stapleton International Airport…west winds gusted to 53 mph on the 11th and to 47 mph on the 12th. The strong Chinook winds warmed temperatures into the mid 50’s on both days.

11-14

In 1997…cold arctic air plunged temperatures below zero across metro Denver. The temperature was below zero for 60 consecutive hours from the afternoon on the 11th to around daybreak on the 14th. The high temperature of only 1 degree below zero on the 12th equaled the record low maximum for the date last set in 1963. The low temperature dipped to 14 degrees below zero on the 12th.

Continue reading January 11 to January 17: This Week in Denver Weather History

2014 Thornton annual weather recap: Annual temps near normal, above average precipitation

2014 has come to a close and as we look back on the year, we can see that it was a relatively average year lacking too much drama.

In terms of temperatures, Thornton saw an average overall annual temperature of 49.4 degrees.  Out at Denver International Airport where the Mile High City’s official records are kept, the average was warmer at 50.5 degrees.  By comparison, Denver’s 1981 to 2010 annual average temperature is 50.4 degrees.

Thornton recorded 29 days of high temperature readings at or above 90 degrees.  On average Denver sees 40 of them.  Denver matched our number with 29 as well.

The hottest reading of the year was 98.2 degrees which came on July 7.  Denver’s highest reading of 100 degrees came on the same date.

At the other end of the spectrum, our coldest temperature was -12.6 degrees on February 5th.  Denver bested us with two -19 degree readings, one on February 5th and another on December 30th.

In all, Thornton saw 155 days with readings below freezing.  Denver recorded 150.  Both were near the average of 156.9 days.

Precipitation for 2014 came in a good ways above average, largely due to a wet May and July.  Thornton took 19.54 inches into the rain bucket while Denver received slightly less with 18.77 inches.  Both were well above the annual average of 14.30 inches.

Snowfall for the calendar year lagged behind average in both Thornton and Denver.  Thornton saw 46.2 inches of the white stuff, Denver a nearly identical 46.3 inches.  On average we expect to see 53.8 inches.

Click here to view Thornton’s 2014 climate summary report.

Thornton, Colorado 2014 Annual Temperature Summary.
Thornton, Colorado 2014 Annual Precipitation Summary.

From the National Weather Service:

CLIMATE REPORT
NATIONAL WEATHER SERVICE BOULDER, CO
200 AM MST THU JAN 1 2015

...................................

...THE DENVER CO CLIMATE SUMMARY FOR THE YEAR OF 2014...

CLIMATE NORMAL PERIOD 1981 TO 2010
CLIMATE RECORD PERIOD 1872 TO 2014

WEATHER         OBSERVED          NORMAL  DEPART  LAST YEAR`S
                 VALUE   DATE(S)  VALUE   FROM    VALUE  DATE(S)
                                          NORMAL
................................................................
TEMPERATURE (F)
RECORD
 HIGH             105   06/26/2012
                        06/25/2012
                        07/20/2005
                        08/08/1878
 LOW              -29   01/09/1875
HIGHEST           100   07/07        64      36      100  07/11
                                                          06/11
LOWEST            -19   12/30        36     -55      -15  12/05
                        02/05
AVG. MAXIMUM     64.6              64.7    -0.1     63.9
AVG. MINIMUM     36.5              36.3     0.2     36.3
MEAN             50.5              50.5     0.0     50.1
DAYS MAX >= 90     29              39.6   -10.6       54
DAYS MAX <= 32     24              20.0     4.0       29
DAYS MIN <= 32    150             156.9    -6.9      169
DAYS MIN <= 0      14               5.8     8.2       11

PRECIPITATION (INCHES)
RECORD
 MAXIMUM        23.31   1967
 MINIMUM         7.29   2008
TOTALS          18.77             14.30    4.47    17.60
DAILY AVG.       0.05              0.03    0.02     0.05
DAYS >= .01        98              79.7    18.3       82
DAYS >= .10        44              34.9     9.1       42
DAYS >= .50        10               7.6     2.4        8
DAYS >= 1.00        4               2.3     1.7        3
GREATEST
 24 HR. TOTAL    2.85   07/29 TO 07/30             09/13 TO 09/14

 STORM TOTAL       2.93                             4.65
 (MM/DD(HH))      07/29(00) TO 07/30(00)   09/09(00) TO 09/15(00)

SNOWFALL (INCHES)
RECORDS
 TOTAL          115.9   1913
                        0
                        0
 24 HR TOTAL     23.6   12/24/1982 TO 12/24/1982
 SNOW DEPTH        MM   MM
TOTALS           46.3              53.8    -7.5     72.1
 LIQUID EQUIV     MM                MM      MM       MM
SINCE 7/1        16.0              22.5    -6.5      8.1
 LIQUID 7/1       MM                MM      MM       MM
SNOWDEPTH AVG.      0                MM      MM        0
DAYS >= TRACE      55              33.3    21.7       60
DAYS >= 1.0        17              16.3     0.7       20
GREATEST
 SNOW DEPTH         6   12/31                          9  02/25
                        12/30
 24 HR TOTAL      5.4   12/29                    02/24 TO 02/24

 STORM TOTAL      5.9                               11.7
 (MM/DD(HH))      12/29(00) 12/30(00)        03/22(00) TO 03/24(00)

DEGREE_DAYS
HEATING TOTAL    5844              6059    -215     6302
 SINCE 7/1       2291              2468    -207     2451
COOLING TOTAL     701               769     -68      999
 SINCE 1/1        701               769     -68      999

FREEZE DATES
RECORD
 EARLIEST     09/08/1962
 LATEST       06/08/2007
EARLIEST                        10/07
LATEST                          05/05
.....................................................

WIND (MPH)
AVERAGE WIND SPEED              10.2
RESULTANT WIND SPEED/DIRECTION   2/214
HIGHEST WIND SPEED/DIRECTION    51/310    DATE  07/11
HIGHEST GUST SPEED/DIRECTION    66/340    DATE  04/29

SKY COVER
POSSIBLE SUNSHINE (PERCENT)   MM
AVERAGE SKY COVER           0.60
NUMBER OF DAYS FAIR           72
NUMBER OF DAYS PC            226
NUMBER OF DAYS CLOUDY         67

AVERAGE RH (PERCENT)     54

WEATHER CONDITIONS. NUMBER OF DAYS WITH
THUNDERSTORM              0     MIXED PRECIP               1
HEAVY RAIN               15     RAIN                      35
LIGHT RAIN               91     FREEZING RAIN              0
LT FREEZING RAIN          2     HAIL                       6
HEAVY SNOW                6     SNOW                      24
LIGHT SNOW               56     SLEET                      1
FOG                     115     FOG W/VIS <= 1/4 MILE     32
HAZE                     57

-  INDICATES NEGATIVE NUMBERS.
R  INDICATES RECORD WAS SET OR TIED.
MM INDICATES DATA IS MISSING.
T  INDICATES TRACE AMOUNT.

January 4 to January 10: This Week in Denver Weather History

This Week In Denver Weather History
January 4 to January 10: This Week in Denver Weather History

Our look back at this week in Denver weather history shows the period has been a very eventful one. There have of course been some significant snow events as you would expect in January. However, perhaps most notable are the number of high wind events that have caused extensive damage and in one case, death. Extreme cold has been another hallmark of the period including Denver’s all-time coldest temperature reading.

From the National Weather Service:

31-6

In 1973…the 31st marked the start of a protracted cold spell that extended into January of 1974 when temperatures dipped below zero on 7 consecutive days. Record daily minimum readings occurred on the 3rd and 5th when the temperature plunged to 17 degrees below zero on both days. A record low daily maximum temperature of only 4 degrees occurred on the 5th.

31-7

In 1941…a protracted cold spell through January 7…1942… Produced below zero low temperatures on 7 of the 8 days. A low temperature of 2 degrees on the 3rd prevented a string of 8 days below zero. The coldest days during the period were the 1st with a high of 2 degrees and a low of 9 degrees below zero…the 4th with a high of 2 degrees and a low of 11 degrees below zero…and the 5th with a high of 26 degrees and a low of 12 degrees below zero.

1-5

In 1940…the first days of the month were characterized by a mixture of drizzle…light snow…and fog. Fog occurred on each day. On the 4th and 5th considerable glazing resulted from freezing drizzle. All objects were coated with a glaze on the windward side. This resulted in very slippery streets…which caused several minor traffic accidents. The glaze was not heavy enough to damage wires and cables.

2-4

In 1949…the worst blizzard in many years struck metro Denver and all of northern Colorado. The storm produced blizzard conditions with wind gusts of 40 to 50 mph all day on the 3rd when temperatures were only in the single digits. This resulted in extremely cold wind chill temperatures of 40 to 55 degrees below zero. Stapleton Airport received 13.3 inches of snow from the storm… While downtown Denver received 11.8 inches. The snow fell for 51 consecutive hours downtown. Numerous lives were lost…and livestock losses were high across the northeastern plains of Colorado where extensive airlift operations were needed to bring supplies and food to isolated communities.

2-5

In 1959…very cold temperatures…to near zero and below…caused power and gas lines…water pipes…and automatic sprinkler systems to break. In Boulder… Merchandise and furnishings were water damaged when pipes burst in a department store…flooding three floors. The temperature was below zero for 38 consecutive hours at Stapleton Airport on the 2nd…3rd…and 4th and plunged to a low of 13 degrees below zero on the 4th.

3-4

In 1982…wind gusting to 85 mph in the Table Mesa area of Boulder caused a few power failures. West winds gusted to only 32 mph at Stapleton International Airport.

In 2000…high winds buffeted the foothills of Boulder County. Wind gusts were reported to 91 mph at Nederland and 81 mph at the National Center for Atmospheric Research on the mesa southwest of Boulder. Southwest winds gusted to only 31 mph at Denver International Airport on the 4th.

4

In 1893…the low temperature dipped to only 52 degrees…the highest minimum temperature ever recorded in January. The high temperature was 64 degrees. The spring-like weather was the result of northwest Chinook winds sustained to 20 mph with gusts as high as 38 mph.

4-5

In 1996…snow began falling across the Front Range foothills and portions of metro Denver on the 4th. Most snowfall amounts ranged from 4 to 6 inches. Icy roads and blowing snow caused a 22 car accident on I-25 north of Denver… Resulting in an 8-mile traffic back-up for several hours. Snowfall totaled 3.2 inches at the site of the former Stapleton International Airport. North-northeast winds gusted to 22 mph at Denver International Airport on the 4th.

5

In 1871…a heavy gale in Boulder caused 500 dollars damage.

In 1895…northwest winds were sustained to 36 mph with gusts as high as 68 mph in the city.

In 1899…strong winds occurred in Boulder…but caused only minor damage.

In 1911…northwest winds were sustained to 41 mph in downtown Denver.

In 1915…north winds were sustained to 40 mph with gusts to 42 mph behind a cold front…which produced only 1.0 inch of snowfall.

In 1972…warm Chinook wind gusts to 85 mph were recorded in Boulder at the National Bureau of Standards and to 60 mph at Jefferson County Airport near Broomfield. The high winds caused severe blowing snow in and near the foothills… Completely blocking traffic in some areas…closing schools and industrial plants. Houses under construction were damaged…and falling trees damaged cars in Boulder. An apartment building under construction was blown down in the Denver area. Northwest wind gusts reached 58 mph at Stapleton International Airport.

In 1989…during the early morning hours with temperatures in the mid-to-upper 30’s…0.25 inch of rain fell at Stapleton International Airport

In 1994…occasional high winds blew across the eastern foothills. Wind gusts to 84 mph were recorded in southwest Boulder and 74 mph in north Boulder. There were also reports of 70 to 80 mph winds along Colorado highway 93 in Jefferson County from Golden to Boulder. Northwest winds gusted to 37 mph at Stapleton International Airport. No significant damage was reported.

In 1999…strong downslope winds developed in the eastern foothills. A wind gust to 100 mph was recorded at Wondervu… Southwest of Boulder. West-northwest winds gusted to only 37 mph at Denver International Airport.

In 2007…a storm system brought heavy snow to areas along the Front Range. The most snow fell in and near the foothills of Boulder and Jefferson counties. Storm totals included: 17 inches 8 miles northwest of Evergreen…16 inches near Conifer…15 inches southwest of Boulder and at Eldorado Springs…14.5 inches near Genesee…12 inches near aspen and Estes Parks…11.5 inches in Boulder…11 inches at Perry park… 9.5 inches near Blackhawk…9 inches in Louisville…7.5 inches in Arvada…7 inches near Erie…6.5 inches near Longmont…and 6 inches at Ralston Reservoir and Littleton. Snowfall totaled 5.6 inches at the site of the former Stapleton International Airport.

Continue reading January 4 to January 10: This Week in Denver Weather History

December 2014 weather recap: Temperatures near normal, a bit more than average snow

The month of December started out quiet and quite dry.  Those mild days however gave way to much colder temperatures during the latter half as well as some nice shots of snow.

For the first 13 days of December 2014, Thornton and the Denver area saw temperatures above normal for the most part.  Conditions were dry and calm.  On the 14th, our first storm system came in and delivered a quick, light snowfall.

We then entered a calm period that lasted up until Christmas.  Temperatures got much colder and some cold temperatures records fell.  We also recorded snow on five out of the last seven days of the month.

It was a white Christmas although it wasn’t until late in the day that the white stuff began falling.  Denver’s 3.4 inches on the 25th made it the third snowiest Christmas Day on record.  Thornton recorded 3.1 inches on the day.

The average temperature for the month in Thornton was 29.2 degrees.  Out at the airport, Denver’s official average was a good bit higher at 31.2 degrees.  The long term December average is 30.0 degrees.

Thornton’s temperatures ranged from a high of 64.0 degrees on the 12th down to a bone chilling low of -12.1 degrees on the 30th.  Denver saw a high mark of 66 degrees and a low of -19 degrees on those days.

Two temperature records were set during the month, both on December 30.  A new record low maximum for the date of 1 degree was recorded (old record was 8 degrees set in 1915).  Additionally, Denver’s -19 degrees that day was a new record low (old record was -11 degrees set in 1898).

In terms of precipitation, Thornton recorded 0.48 inches of liquid precipitation.  Denver was a bit wetter with 0.59 inches.  Both readings were above Denver’s December average of 0.35 inches.

On average the Mile High City records 8.5 inches of snowfall during December.  In 2014 the month brought 8.8 inches to Thornton while at the airport Denver recorded 12.0 inches.

Click here to view Thornton’s December 2014 climate report.

Thornton, Colorado December 2014 Temperature Summary.
Thornton, Colorado December 2014 Precipitation Summary.

From the National Weather Service:

CLIMATE REPORT
NATIONAL WEATHER SERVICE BOULDER, CO
1041 PM MST THU JAN 1 2015
 
...................................
 
...THE DENVER CO CLIMATE SUMMARY FOR THE MONTH OF DECEMBER 2014...
 
CLIMATE NORMAL PERIOD 1981 TO 2010
CLIMATE RECORD PERIOD 1872 TO 2014
 
WEATHER         OBSERVED          NORMAL  DEPART  LAST YEAR`S
                 VALUE   DATE(S)  VALUE   FROM    VALUE  DATE(S)
                                          NORMAL
................................................................
TEMPERATURE (F)
RECORD
 HIGH              79   12/05/1939
 LOW              -25   12/22/1990
                        12/24/1876
HIGHEST            66   12/12        62       4       68  12/18
LOWEST            -19   12/30        -4     -13      -15  12/05
AVG. MAXIMUM     44.1              42.8     1.3     42.9
AVG. MINIMUM     18.5              17.1     1.4     14.0
MEAN             31.3              30.0     1.3     28.4
DAYS MAX >= 90      0               0.0     0.0        0
DAYS MAX <= 32      5               5.8    -0.8        8
DAYS MIN <= 32     31              29.4     1.6       29
DAYS MIN <= 0       2               2.0     0.0        6   
PRECIPITATION (INCHES) 
RECORD
  MAXIMUM         5.21   1913
  MINIMUM         0.00   1881 
TOTALS           0.59              0.35    0.24     0.25 
DAILY AVG.       0.02              0.01    0.01     0.01 
DAYS >= .01         7               4.1     2.9        7
DAYS >= .10         2               1.1     0.9        1
DAYS >= .50         0               0.1    -0.1        0
DAYS >= 1.00        0               0.0     0.0        0
GREATEST
 24 HR. TOTAL    0.18   12/29 TO 12/30           12/03 TO 12/04
 
SNOWFALL (INCHES)
RECORDS
 TOTAL           57.4   1913
TOTALS           12.0               8.5
 
DEGREE_DAYS
HEATING TOTAL    1037              1086     -49     1128
 SINCE 7/1       2291              2468    -177     2451
COOLING TOTAL       0                 0       0        0
 SINCE 1/1        701               769     -68      999
 
FREEZE DATES
RECORD
 EARLIEST     09/08/1962
 LATEST       06/08/2007
EARLIEST                        10/07
LATEST                          05/05
.....................................................
 
WIND (MPH)
AVERAGE WIND SPEED              8.7
RESULTANT WIND SPEED/DIRECTION   2/218
HIGHEST WIND SPEED/DIRECTION    41/340    DATE  12/23
HIGHEST GUST SPEED/DIRECTION    52/330    DATE  12/23
 
SKY COVER
POSSIBLE SUNSHINE (PERCENT)   MM
AVERAGE SKY COVER           0.60
NUMBER OF DAYS FAIR            4
NUMBER OF DAYS PC             19
NUMBER OF DAYS CLOUDY          8
 
AVERAGE RH (PERCENT)     59
 
WEATHER CONDITIONS. NUMBER OF DAYS WITH
THUNDERSTORM              0     MIXED PRECIP               0
HEAVY RAIN                0     RAIN                       1
LIGHT RAIN                1     FREEZING RAIN              0
LT FREEZING RAIN          0     HAIL                       0
HEAVY SNOW                1     SNOW                       4
LIGHT SNOW                8     SLEET                      0
FOG                      12     FOG W/VIS <= 1/4 MILE      3
HAZE                      4
 
-  INDICATES NEGATIVE NUMBERS.
R  INDICATES RECORD WAS SET OR TIED.
MM INDICATES DATA IS MISSING.
T  INDICATES TRACE AMOUNT.

Thornton’s January weather preview: Normally cold but not always snowy

Denver's January weather and climatology preview for 2013.
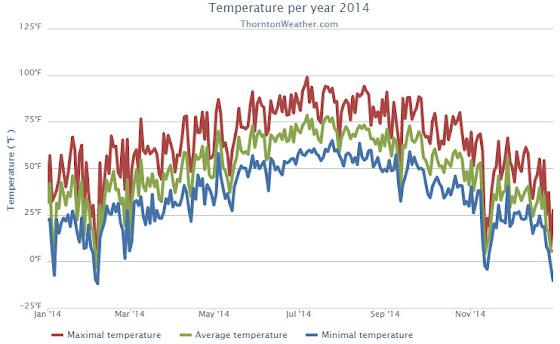
As we begin the new year the winter chill begins to set in.  While January can see its share of extremes, the month historically sees stable temperatures and is usually relatively dry.

January ranks as the second coldest month in Denver next to December with average temperatures remaining virtually the same from the start to the end of the month.  In terms of snowfall, the month only ranks as the fourth snowiest and it is not uncommon for it to be quite dry.

What does January 2013 hold for us?  Indications are that we may very well continue the recent pattern of below normal temperatures and relatively dry conditions.

For the complete January preview including a look at historical averages and extremes, click here. 

Denver smashes two low temperature records for December 30

Record Cold Temperatures
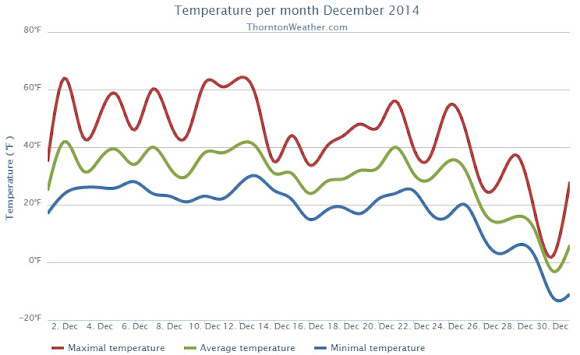
Our recent blast of Arctic air sent the mercury tumbling and in the process broke two daily records for December 30th.

The official “high” temperature in Denver, as measured at DIA, reached only 1 degree at 1:23pm.  This easily bested the record low high for the date of 8 degrees set in 1915.  Thornton was slightly warmer than the airport with a high temperature of 2.4 degrees.

Additionally, at 9:23pm, the mercury plummeted to -19 degrees at DIA.  This crushes the old record low temperature for December 30 of -11 degrees set in 1898.  Here in Thornton we did not get quite as cold with a low temperature reading of -12.1 degrees occurring at 10:50pm.

  • Stay up to date with Thornton’s weather: Be sure to ‘like’ us on Facebook, follow us on Twitter and add us to your Google+ circles.

December 2014 top shots: Monthly photo slideshow

December 14, 2014 - Ducks and geese seek high ground in Thornton. (Tony's Takes)
December 14, 2014 – Ducks and geese seek high ground in Thornton. (Tony’s Takes)

The month of December can offer everything from bone dry conditions to bone chilling cold and monstrous snowstorms.  The weather and wildlife all afford an abundance of photo opportunities as our December photo slideshow shows.

Leaves have fallen from trees now and the landscape can sometimes look quite stark.  However it only takes a quick shot of snow to change that picture greatly.  Throw in gorgeous sunrises and sunsets, plenty of wildlife big and small, kids playing and much more and the month can be quite colorful and eventful.

  • Slideshow updated December 29, 2014
  • To learn more about how to send your photo to us for inclusion in the slideshow, see below the slideshow.

Showcasing images captured by ThorntonWeather.com readers as well as some of our own, our monthly slideshow covers the entire gamut of weather-related imagery.

Sunsets, sunrises, wildlife and of course every type of weather condition are vividly depicted in images captured from yours and our cameras.

[flickr_set id=”72157649883515106″]

What is missing in the slideshow above?  Your photo!

Our monthly photo slideshow is going to feature images that we have taken but more importantly images that you have captured.  The photos can be of anything even remotely weather-related.

Landscapes, current conditions, wildlife, pets, kids.  Whimsical, newsy, artsy.  Taken at the zoo, some other area attraction, a local park, a national park or your backyard.  You name it, we want to see and share it!

Images can be taken in Thornton, Denver or anywhere across the extraordinary Centennial State.  We’ll even take some from out of state if we can tie it to Colorado somehow.

We’ll keep the criteria very open to interpretation with just about any image eligible to be shown in our slideshows.

What do you win for having your image in our slideshow?  We are just a ‘mom and pop’ outfit and make no money from our site so we really don’t have the means to provide prizes.  However you will have our undying gratitude and the satisfaction that your images are shared on the most popular website in Thornton.

To share you images with us and get them included in the slideshow just email them to us or share them with ThorntonWeather.com on any of the various social media outlets.  Links are provided below.

So come on, get those camera’s rolling!