Category Archives: Climatology

2015 Thornton annual weather recap: Above normal temps, lots of precipitation

The year that was lacked any major drama in terms of the weather.  Winter and severe weather conditions during their seasons were pretty typical.  Overall, the year saw temperatures and precipitation end above average.

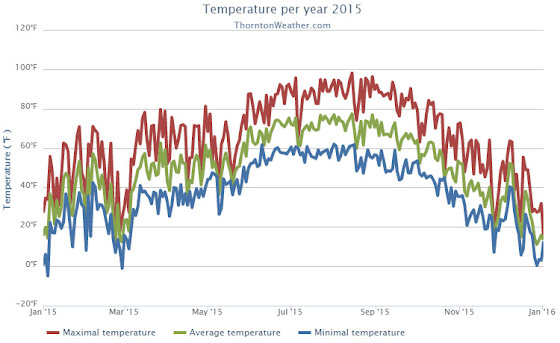
Thornton’s average annual temperature for 2015 came in at 51.1 degrees.  That was a bit above Denver’s historical average of 50.5 degrees.  Out at DIA where the Mile High City’s official measurements were taken, the average was 52.0 degrees.  Denver’s reading made the year the 18th warmest on record.

Temperatures in Thornton ranged from a high of 98.1 degrees on August XX down to a low of -3.7 degrees on January XX.  We saw 44 days of high temperatures at or above 90 degrees and 131 days with low temperatures below the freezing mark.

Out at the airport, Denver saw a maximum of 98 degrees on August 15 and a low of 10 degrees below zero on January 4.  Officially the city saw 48 90 degrees days and 126 days with lows below freezing.

Denver averages 39.6 days of 90 degrees temperatures and 156.9 days with lows below 32 degrees.

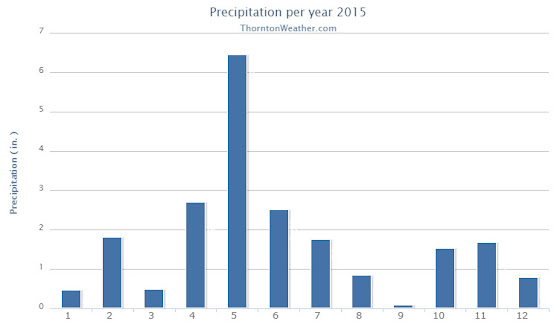
In terms of precipitation, both Thornton and Denver saw their rain buckets record above normal levels.  Thornton measured 20.81 inches while DIA was drier with 18.31 inches.  Both marks were well above the annual average of 14.30 inches.  For Denver, it was the 25th wettest year on record.

Snow as well finished above normal for the calendar year.  Average is 53.8 inches.  Thornton recorded a hefty 72.1 inches of the white stuff.  Denver lagged us but was still above average with 64.4 inches.  February was the snowiest month for both locations with Thornton recording 26.7 inches and Denver 22.4 inches.

Click here to view Thornton’s 2015 climate summary report.

Thornton, Colorado's 2015 Temperature Summary. (ThorntonWeather.com)
Thornton, Colorado’s 2015 Temperature Summary. (ThorntonWeather.com)
Thornton, Colorado's 2015 Precipitation Summary. (ThorntonWeather.com)
Thornton, Colorado’s 2015 Precipitation Summary. (ThorntonWeather.com)

From the National Weather Service:

CLIMATE REPORT
NATIONAL WEATHER SERVICE BOULDER, CO
730 AM MST SAT JAN 2 2016
...................................

...THE DENVER CO CLIMATE SUMMARY FOR THE YEAR OF 2015...

CLIMATE NORMAL PERIOD 1981 TO 2010
CLIMATE RECORD PERIOD 1872 TO 2015

WEATHER         OBSERVED          NORMAL  DEPART  LAST YEAR`S
                 VALUE   DATE(S)  VALUE   FROM    VALUE  DATE(S)
                                          NORMAL
................................................................
TEMPERATURE (F)
RECORD
 HIGH             105   06/26/2012
                        06/25/2012
                        07/20/2005
 LOW              -29   01/09/1875
HIGHEST            98   08/15        64      34      100  07/07
LOWEST            -10   01/04        36     -46      -19  12/30
                                                          02/05
AVG. MAXIMUM     65.4              64.7     0.7     64.6
AVG. MINIMUM     38.6              36.3     2.3     36.5
MEAN             52.0              50.5     1.5     50.5
DAYS MAX >= 90     48              39.6     8.4       29
DAYS MAX <= 32     29              20.0     9.0       24
DAYS MIN <= 32    126             156.9   -30.9      150
DAYS MIN <= 0       7               5.8     1.2       14

PRECIPITATION (INCHES)
RECORD
 MAXIMUM        23.31   1967
 MINIMUM         7.29   2008
TOTALS          18.31             14.30    4.01    18.77
DAILY AVG.       0.05              0.03    0.02     0.05
DAYS >= .01       107              79.7    27.3       98
DAYS >= .10        49              34.9    14.1       44
DAYS >= .50        10               7.6     2.4       10
DAYS >= 1.00        2               2.3    -0.3        4
GREATEST
 24 HR. TOTAL    1.41   04/16 TO 04/17           2.85 07/29 TO 07/30

SNOWFALL (INCHES)
RECORDS
 TOTAL          115.9   1913


 24 HR TOTAL     23.6   12/24/1982 TO 12/24/1982
 SNOW DEPTH        MM   MM
TOTALS           64.4              53.8    10.6     46.1
 LIQUID EQUIV    6.44              5.40    1.04     4.61
SINCE 7/1        22.6              22.5     0.1     16.0
 LIQUID 7/1      2.26              2.20    0.06     1.60
SNOWDEPTH AVG.      0                MM      MM        0
DAYS >= TRACE      51              33.3    17.7       55
DAYS >= 1.0        25              16.3     8.7       17
GREATEST
 SNOW DEPTH         9   02/23                          6  12/31

 STORM TOTAL       10.5                             5.9
 (MM/DD(HH))       02/20 TO 02/23             12/29 TO 12/30

DEGREE_DAYS
HEATING TOTAL    5479              6059    -580     5844
 SINCE 7/1       2187              2468    -281     2291
COOLING TOTAL     877               769     108      701
 SINCE 1/1        877               769     108      701

FREEZE DATES
RECORD
 EARLIEST     09/08/1962
 LATEST       06/08/2007
EARLIEST                        10/07
LATEST                          05/05
..................................................

WIND (MPH)
AVERAGE WIND SPEED              9.6
RESULTANT WIND SPEED/DIRECTION   2/195
HIGHEST WIND SPEED/DIRECTION    46/350    DATE  11/17
HIGHEST GUST SPEED/DIRECTION    60/330    DATE  07/15

SKY COVER
POSSIBLE SUNSHINE (PERCENT)   MM
AVERAGE SKY COVER           0.60
NUMBER OF DAYS FAIR           80
NUMBER OF DAYS PC            208
NUMBER OF DAYS CLOUDY         77

AVERAGE RH (PERCENT)     56

WEATHER CONDITIONS. NUMBER OF DAYS WITH
THUNDERSTORM             71     MIXED PRECIP               0
HEAVY RAIN               14     RAIN                      36
LIGHT RAIN              101     FREEZING RAIN              0
LT FREEZING RAIN          4     HAIL                       5
HEAVY SNOW                9     SNOW                      31
LIGHT SNOW               53     SLEET                      1
FOG                     111     FOG W/VIS <= 1/4 MILE     40
HAZE                     58

-  INDICATES NEGATIVE NUMBERS.
R  INDICATES RECORD WAS SET OR TIED.
MM INDICATES DATA IS MISSING.
T  INDICATES TRACE AMOUNT.

_____________________________________________________________________

..........2015 WAS WETTER AND WARMER THAN NORMAL..........

.........................TEMPERATURES...........................

TEMPERATURES FOR 2015 FINISHED ABOVE NORMAL WITH A MEAN OF 52.0
DEGREES F. WHICH IS 1.5 DEGREES ABOVE NORMAL. THIS MAKES 2015 THE
18TH WARMEST YEAR ON RECORD. THERE WERE 48 DAYS IN WHICH THE
TEMPERATURE REACHED OR EXCEEDED 90 DEGREES AND NO DAYS REACHING THE
CENTURY MARK. AUGUST 15TH WAS THE HOTTEST DAY OF YEAR WITH A
TEMPERATURE OF 98 DEGREES. THERE WERE 4 DAYS DURING THE YEAR IN
WHICH THE TEMPERATURE FELL BELOW ZERO. THE COLDEST TEMPERATURE
RECORDED FOR THE YEAR OCCURRED ON JANUARY 4TH WITH A READING OF TEN
DEGREES BELOW ZERO.

 MONTH    MEAN TEMP  DEPARTURE     WARMEST       COLDEST
         (DEGREES F)FROM NORMAL  (DEGREES F)   (DEGREES F)
JANUARY     33.0       +3.2      40.3(1986)    16.8(1930)
FEBRUARY    33.8       +1.3      43.7(1954)    17.7(1899)
MARCH       45.0       +4.6      50.4(1910)    26.4(1912)
APRIL       48.7       +1.3      56.4(1981)    38.8(1920)
MAY         53.0       -4.1      64.7(1934)    48.7(1917)
JUNE        69.5       +2.1      75.0(2012)    60.6(1967)
JULY        72.8       -1.4      78.9(2012)    67.3(1895)
AUGUST      74.0       +1.5      77.0(2011)    66.5(1915)
SEPTEMBER   69.4       +6.0      69.4(2015)    54.7(1912)
OCTOBER     56.5       +5.6      59.9(1950)    38.9(1969)
NOVEMBER    38.5       +0.2      50.9(1949)    22.0(1930)
DECEMBER    29.4       -0.6      43.8(1933)    17.4(1983)
ANNUAL      52.0       +1.5      54.9(1934)    47.8(1912)

.......................PRECIPITATION............................

2015 WAS A GOOD YEAR FOR PRECIPITATION IN DENVER. THE FINAL TALLY
FOR THE YEAR WAS 18.31 INCHES WHICH IS 4.01 INCHES ABOVE THE NORMAL
OF 14.30 INCHES. THIS MAKES 2015 THE 25TH WETTEST YEAR ON RECORD.

 MONTH PRECIP     DEPARTURE     WETTEST       DRIEST
        (INCHES)  FROM NORMAL  (INCHES)      (INCHES)
JANUARY   0.38      -0.03      2.25(1883)    0.01 (1952...1934...1933)
FEBRUARY  1.25      +0.88      2.01(1934)    0.01(1970)
MARCH     0.79      -0.13      4.56(1900)    0.03(1963)
APRIL     2.65      +0.94      8.24(1900)    0.03(1963)
MAY       3.76      +1.64      8.57(1876)    0.06(1974)
JUNE      2.53      +0.55      4.96(1882)      T (1890)
JULY      1.06      -1.10      6.41(1965)    0.01(1901)
AUGUST    1.18      -0.51      5.85(1979)    0.02(1924)
SEPTEMBER 0.11      -0.85      5.61(2013)      T (1892...1944)
OCTOBER   1.76      +0.74      4.17(1969)      T (1934)
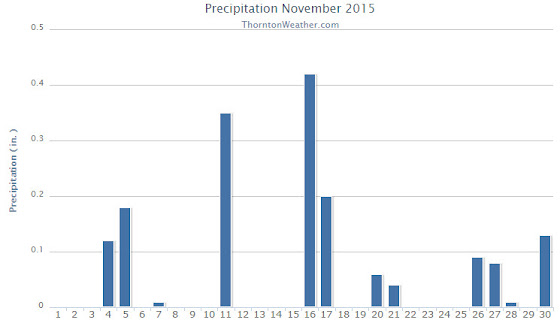
NOVEMBER  2.13      +1.52      3.21(1946)      T (1899...1901...1949)
DECEMBER  0.71      +0.36      5.21(1913)    0.00(1881)
ANNUAL   18.31      +4.01     23.31(1967)    7.29(2008)

...........................SNOWFALL..............................

64.4 INCHES OF SNOW FELL IN 2015...WHICH IS 10.6 INCHES ABOVE THE
NORMAL OF 53.8 INCHES. FEBRUARY 2015 WAS SNOWIEST FEBRUARY ON
RECORD WITH 22.4 INCHES OF SNOW MEASURED AT DENVER INTERNATIONAL
AIRPORT. SNOW ALSO FELL IN DENVER ON CHRISTMAS DAY...WITH 2.3
MEASURED AT THE AIRPORT.

 MONTH  SNOWFALL  DEPARTURE     SNOWIEST      LEAST SNOWIEST
        (INCHES)  FROM NORMAL   (INCHES)         (INCHES)
JANUARY     7.2      -0.2       24.3(1992)      T (2003...1934)
FEBRUARY   22.4     +16.7       22.4(2015)      T (2009)
MARCH       2.9      -7.8       35.2(2003)      T (2012...1995)
APRIL       5.3      -1.5       33.8(1933)      0 (1995...1992...1943...1930)
MAY         4.0      +2.9       15.5(1898)      0 (NUMEROUS YEARS)
SEPTEMBER   0.0      -1.3       17.2(1971)      0 (NUMEROUS YEARS)
OCTOBER     0.0      -4.0       31.2(1969)      0 (NUMEROUS YEARS)
NOVEMBER   11.3      +2.6       42.6(1946)      0 (1995)
DECEMBER   11.3      +2.8       57.4(1913)      0 (1881)
ANNUAL     64.4     +10.6      115.9(1913)    18.9(1887)

December 2015 weather recap: Average temperatures, above normal precipitation

Warm and dry were the key weather words for the start of December 2015.  That however changed as the month progressed and colder, wetter weather arrived.

High pressure dominated the start of the month leading to 10 out of the first 11 days of the month seeing above normal temperatures.  No precipitation was recorded over that period as well.

Things began to change on the 12th of the month as Thornton saw a couple of inches of snowfall and temperatures dropped.  A second, far more potent storm arrived on the 15th giving the Mile High City its heaviest snowfall of the season to that point.

Warmer and drier conditions returned up until Christmas.  For the holiday, temperatures were over 15 degrees below normal and the afternoon and evening brought a white Christmas with moderate snowfall.

We then wrapped up the month with a string of well below average temperatures.  In fact, the mercury remained below the freezing mark for the balance of the month.

Thornton’s average temperature for the month came in at 29.3 degrees.  That is just below the long term Denver average of 30.0 degrees.  Out at the airport where Denver’s official measurements are made, the average was virtually identical to Thornton’s at 29.4 degrees.

Highs in Thornton ranged from a 66.5 degrees maximum on the 9th down to a low of 00.3 degrees on the morning of the 28th.  Denver saw its warmest temperature on the 9th also with a high of 69 degrees.  Its low came in at 0 degrees on the 17th and 28th.

In terms of precipitation, Thornton recorded 0.79 inches in the bucket.  At DIA, Denver was just a bit drier at 0.71 inches.  The December average for Denver is 0.35 inches.

Denver averages 8.7 inches of snowfall during December.  Both Thornton and Denver bested the average with 14.2 inches and 11.3 inches respectively.

Click here to view Thornton’s December 2015 climate report.

Thornton, Colorado's December 2015 temperature summary. (ThorntonWeather.com)
Thornton, Colorado’s December 2015 temperature summary. (ThorntonWeather.com)
Thornton, Colorado's December 2015 precipitation summary. (ThorntonWeather.com)
Thornton, Colorado’s December 2015 precipitation summary. (ThorntonWeather.com)

From the National Weather Service:

CLIMATE REPORT
NATIONAL WEATHER SERVICE BOULDER, CO
130 PM MST FRI JAN 1 2016
...................................

...THE DENVER CO CLIMATE SUMMARY FOR THE MONTH OF DECEMBER 2015...

CLIMATE NORMAL PERIOD 1981 TO 2010
CLIMATE RECORD PERIOD 1872 TO 2015

WEATHER         OBSERVED          NORMAL  DEPART  LAST YEAR`S
                 VALUE   DATE(S)  VALUE   FROM    VALUE  DATE(S)
                                          NORMAL
................................................................
TEMPERATURE (F)
RECORD
 HIGH              79   12/05/1939
 LOW              -25   12/22/1990
                        12/24/1876
HIGHEST            69   12/09        62       7       66  12/12
LOWEST              0   12/28        -4       4      -19  12/30
                        12/17
AVG. MAXIMUM     40.9              42.8    -1.9     44.1
AVG. MINIMUM     17.9              17.1     0.8     18.5
MEAN             29.4              30.0    -0.6     31.3
DAYS MAX >= 90      0               0.0     0.0        0
DAYS MAX <= 32     10               5.8     4.2        5
DAYS MIN <= 32     28              29.4    -1.4       31
DAYS MIN <= 0       2               2.0     0.0        2

PRECIPITATION (INCHES)
RECORD
 MAXIMUM         5.21   1913
 MINIMUM         0.00   1881
TOTALS           0.71              0.35    0.36     0.59
DAILY AVG.       0.02              0.01    0.01     0.02
DAYS >= .01         5               4.1     0.9        7
DAYS >= .10         3               1.1     1.9        2
DAYS >= .50         0               0.1    -0.1        0
DAYS >= 1.00        0               0.0     0.0        0
GREATEST
 24 HR. TOTAL    0.32   12/15 TO 12/15

SNOWFALL (INCHES)
RECORDS
 TOTAL           11.3               8.7
RECORD DECEMBER  57.4                             1913

DEGREE_DAYS
HEATING TOTAL    1097              1086      11     1037
 SINCE 7/1       2187              2468    -281     2291
COOLING TOTAL       0                 0       0        0
 SINCE 1/1        877               769     108      701

FREEZE DATES
RECORD
 EARLIEST     09/08/1962
 LATEST       06/08/2007
EARLIEST                        10/07
LATEST                          05/05
.................................................

WIND (MPH)
AVERAGE WIND SPEED              9.8
RESULTANT WIND SPEED/DIRECTION   4/210
HIGHEST WIND SPEED/DIRECTION    41/280    DATE  12/09
HIGHEST GUST SPEED/DIRECTION    64/290    DATE  12/15

SKY COVER
POSSIBLE SUNSHINE (PERCENT)   MM
AVERAGE SKY COVER           0.50
NUMBER OF DAYS FAIR            5
NUMBER OF DAYS PC             22
NUMBER OF DAYS CLOUDY          4

AVERAGE RH (PERCENT)     58

WEATHER CONDITIONS. NUMBER OF DAYS WITH
THUNDERSTORM              0     MIXED PRECIP               0
HEAVY RAIN                0     RAIN                       0
LIGHT RAIN                0     FREEZING RAIN              0
LT FREEZING RAIN          0     HAIL                       0
HEAVY SNOW                1     SNOW                       3
LIGHT SNOW                8     SLEET                      0
FOG                      12     FOG W/VIS <= 1/4 MILE      3
HAZE                      6

-  INDICATES NEGATIVE NUMBERS.
R  INDICATES RECORD WAS SET OR TIED.
MM INDICATES DATA IS MISSING.
T  INDICATES TRACE AMOUNT.

Dreaming of a white Christmas in Denver? Odds are not historically that great

As Christmas gets closer everyone always wonders if we are going to get the proverbial white Christmas. Unfortunately, if you look at Denver and Thornton weather history, the chances aren’t all that good but it also depends on what you define as a white Christmas.

If to you a white Christmas means having actual snowfall on Christmas Day the chances aren’t that good. But, if simply having snow on the ground suffices, the chances improve considerably.

For a complete look at Denver’s Christmas weather statistics, click here.

For the latest Thornton weather forecast for Christmas, check out our forecast page.

White Christmas probability map for the contiguous United States. Click for larger view. (NOAA)

Astronomical winter begins with the winter solstice on Monday

The Earth at the Winter Solstice.  The Northern Hemisphere sees their shortest day of the year while the Southern Hemisphere gets its longest. (NASA)
The Earth at the Winter Solstice. The Northern Hemisphere sees their shortest day of the year while the Southern Hemisphere gets its longest. (NASA)

Astronomical winter arrives in Thornton tonight and with the solstice also comes the shortest day of the year.

Winter officially begins at 9:49pm today. The Winter Solstice occurs when the North Pole is tilted at its furthest from the sun – 23.5 degrees away. This results in the shortest day of the year in the Northern Hemisphere.

Here in Denver, with sunrise at 7:17am and sunset at 4:39pm, our day today is 9 hours, 21 minutes and 14 seconds long. Tomorrow it will be one second longer and each day from now through to the Summer Solstice in June will get gradually longer as well.

While we have a short day today, it is nothing like what will be experienced in the Arctic Circle.  Areas north of there to the North Pole will have no direct sunlight at all.  Conversely, areas south of the Antarctic Circle toward the South Pole will have 24 hours of daylight and have a midnight sun.

Did you know that there is a difference between the astronomical seasons that we are discussing here and meteorological seasons?

Meteorological seasons differ slightly and are geared toward matching the calendar with the annual temperature cycle. This is done primarily for meteorological observing and forecasting and in many ways it is more logical than the astronomical seasons.

For the Northern Hemisphere, the meteorological spring covers the months of March, April and May. Summer brings the hottest months of the year and so meteorological summer is June, July and August. Meteorological fall then is September, October and November followed by the coldest months of December, January and February as meteorological winter.

NOAA details the chances for a white Christmas for the United States

White Christmas probability map for the contiguous United States. (NOAA)
White Christmas probability map for the contiguous United States. Click for larger view. (NOAA)

With our most recent snowstorm, the Colorado Front Range is likely to enjoy a white Christmas (defined as 1 inch of snow on the ground on Christmas Day).  Other locations in the United States of course are not quite so lucky and historically, Colorado can be quite hit or miss.

Below is the latest narrative from NOAA.  To the right is a probability map – click it to view full size.

From NOAA:

Minnesota. Maine. Upstate New York. The Allegheny Mountains of Pennsylvania and West Virginia. Practically anywhere in Idaho. And of course, the Rockies or the Sierra Nevada Mountains. These are the places where weather history suggests you want to be if you’re looking for the best chance of a white Christmas.

The map at right shows the historic probability of there being at least 1-inch of snow on the ground in the Lower 48 states on December 25 based on the latest (1981-2010) U.S. Climate Normals from NOAA’s National Climatic Data Center.  Dark gray shows places where the probability is less than 10 percent, while white shows probabilities greater than 90  percent.

The 1981–2010 Climate Normals are the latest three-decade averages of several climatological measurements. This dataset contains daily and monthly Normals of temperature, precipitation, snowfall, heating and cooling degree days, frost/freeze dates, and growing degree days calculated from observations at approximately 9,800 stations operated by NOAA’s National Weather Service.

While the map shows the climatological probability that a snow depth of at least one inch will be observed on December 25, the actual conditions this year may vary widely from these probabilities because the weather patterns present will determine the snow on the ground or snowfall on Christmas day. These probabilities are useful as a guide only to show where snow on the ground is more likely.  For prediction of your actual weather on Christmas Day, check out your local forecast at Weather.gov.

You can locate Normals data for the observing station closest to you using the NCDC’sinteractive map.

If you would like to keep track of the snowfall across the United States on a daily basis, see the National Operational Hydrologic Remote Sensing Center’s National Snow Analyses. For a more detailed assessment of the probability of a white Christmas as well as documentation of the methodology used to calculate the map’s underlying climatological statistics, see the scientific paper, White Christmas? An Application of NOAA’s 1981-2010 Daily Normals, by NCEI scientists and published in the Bulletin of the American Meteorological Society. You can also download a spreadsheet to see the full list of stations and their historic probabilities.

This post was adapted from an article first published by the National Climatic Data Center. It was first published on December 11, 2013, and is reviewed each year and updated as needed.

November 2015 weather recap: Colder, wetter and snowier than normal for Thornton

Mild, dry conditions started the month of November 2015 in Thornton.  That however soon gave way to colder temperatures and moisture in the form of snow, something that repeated itself multiple times during the month.

The first three days saw temperatures well above normal and in the 70s with no precipitation.  That changed however with our first snowfall of the season coming on the 5th of the month.

The balance of the month was an active one as a series of troughs moved through and cold fronts dug in from the north.  A general pattern of a few mild days followed by a few unsettled days was the pattern.  By the time all was said and done, the month more than made up for the lack of snow in October.

In terms of temperatures, Thornton’s overall temperature for the month was 36.9 degrees.  Out at DIA where Denver’s official records are kept, the reading was a good bit warmer at 38.5 degrees.  While that meant the Mile High City was 0.2 degrees above average, Thornton was clearly a good bit cooler than normal.

Temperatures in Thornton ranged from a high of 75.5 degrees on the third of the month down to a low of 6.7 degrees on the morning of the 27th.  DIA saw a maximum of 75 degrees and a minimum of 3 degrees on those same dates.

Precipitation was well above the November average of 0.61 inches at both locations.  Thornton saw 1.65 inches of liquid precip while Denver bested us with 2.13 inches.

Snow was the primary source of precipitation for the month.  Thornton recorded a very healthy 14.5 inches of the white stuff.  The airport lagged with 11.3 inches.  Both were well above the November average of 8.7 inches.

Click here to view Thornton’s November 2015 climate report.

Thornton, Colorado's November 2015 Temperatur?e Summary. (ThorntonW?eather.com?)
Thornton, Colorado’s November 2015 Temperatur?e Summary. (ThorntonW?eather.com?)
Thornton, Colorado's November 2015 Precipitat?ion Summary. (ThorntonW?eather.com?)
Thornton, Colorado’s November 2015 Precipitat?ion Summary. (ThorntonW?eather.com?)

From the National Weather Service:

CLIMATE REPORT
NATIONAL WEATHER SERVICE BOULDER, CO
1147 AM MST TUE DEC 1 2015

...................................

...THE DENVER CO CLIMATE SUMMARY FOR THE MONTH OF NOVEMBER 2015...

CLIMATE NORMAL PERIOD 1981 TO 2010
CLIMATE RECORD PERIOD 1872 TO 2015

WEATHER         OBSERVED          NORMAL  DEPART  LAST YEAR`S
                 VALUE   DATE(S)  VALUE   FROM    VALUE  DATE(S)
                                          NORMAL
................................................................
TEMPERATURE (F)
RECORD
 HIGH              80   11/08/2006
 LOW              -18   11/29/1877
HIGHEST            75   11/03        73       2       72  11/29
                                                          11/01
LOWEST              3   11/27        -6       9      -14  11/13
AVG. MAXIMUM     51.2              52.1    -0.9     50.6
AVG. MINIMUM     25.7              24.5     1.2     21.8
MEAN             38.5              38.3     0.2     36.2
DAYS MAX >= 90      0               0.0     0.0        0
DAYS MAX <= 32      5               2.3     2.7        5
DAYS MIN <= 32     24              23.4     0.6       22
DAYS MIN <= 0 0 0.6 -0.6 4 PRECIPITATION (INCHES) RECORD MAXIMUM 3.21 1946 MINIMUM T 1899 1901 1949 TOTALS 2.13 0.61 1.52 0.76 DAILY AVG. 0.07 0.02 0.05 0.03 DAYS >= .01        11               4.7     6.3        6
DAYS >= .10         6               1.6     4.4        3
DAYS >= .50         1               0.0     1.0        0
DAYS >= 1.00        0               0.0     0.0        0
GREATEST
 24 HR. TOTAL    0.88   11/04 TO 11/05

SNOWFALL (INCHES)
RECORDS
 TOTAL           11.3               8.7
RECORD NOVEMBER  42.6                             1946

DEGREE_DAYS
HEATING TOTAL     789               801     -12      857
 SINCE 7/1       1090              1382    -292     1254
COOLING TOTAL       0                 0       0        0
 SINCE 1/1        877               769     108      701

FREEZE DATES
RECORD
 EARLIEST     09/08/1962
 LATEST       06/08/2007
EARLIEST      11/05             10/07
LATEST                          05/05
....................................................

WIND (MPH)
AVERAGE WIND SPEED              10.4
RESULTANT WIND SPEED/DIRECTION   3/225
HIGHEST WIND SPEED/DIRECTION    46/350    DATE  11/17
HIGHEST GUST SPEED/DIRECTION    57/290    DATE  11/18

SKY COVER
POSSIBLE SUNSHINE (PERCENT)   MM
AVERAGE SKY COVER           0.40
NUMBER OF DAYS FAIR           11
NUMBER OF DAYS PC             14
NUMBER OF DAYS CLOUDY          5

AVERAGE RH (PERCENT)     55

WEATHER CONDITIONS. NUMBER OF DAYS WITH
THUNDERSTORM              1     MIXED PRECIP               0
HEAVY RAIN                2     RAIN                       3
LIGHT RAIN                3     FREEZING RAIN              0
LT FREEZING RAIN          2     HAIL                       0
HEAVY SNOW                1     SNOW                       8
LIGHT SNOW               11     SLEET                      0
FOG                      13     FOG W/VIS <= 1/4 MILE      3
HAZE                      5

-  INDICATES NEGATIVE NUMBERS.
R  INDICATES RECORD WAS SET OR TIED.
MM INDICATES DATA IS MISSING.
T  INDICATES TRACE AMOUNT.

Thornton’s December preview: Winter arrives, typically with cold and snow

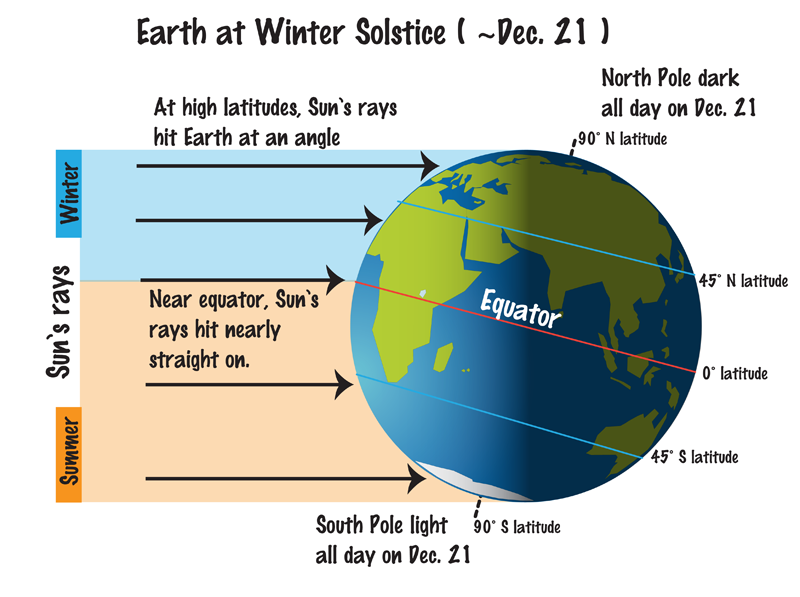
The month of December brings with it the official start of winter and oftentimes, colder and snowier weather conditions. It however can also offer unseasonably warm temperatures and bone dry conditions.

Overall December’s monthly mean temperature of 30.0 degrees (1981 – 2010 averages) makes it our coldest month.  Snow is always on everyone’s mind this time of year but December is only our 3rd snowiest month behind March and November with an average of 8.5 inches of the white stuff.

We closed out November quite wet and chilly and that is expected to continue into the first part of December.  Long term models then point to a continuation of above normal precipitation but near normal temperatures.

Get all the details on Thornton’s December weather including a look back at historical events and a look at the long range forecast in our December weather preview here.

  • Stay up to date with Thornton’s weather: Be sure to ‘like’ us on Facebook, follow us on Twitter and add us to your Google+ circles.

October 2015 weather recap: Warmer and wetter than normal

A mild October allowed for plenty of outdoor opportunities including amazing sunrises like this one in Thornton along the South Platte River. (Tony's Takes)
A mild October allowed for plenty of outdoor opportunities including amazing sunrises like this one in Thornton along the South Platte River. (Tony’s Takes)

Thornton’s October was an unusually warm one with daytime highs more what we would expect in September.  It would also have been a dry one were it not for three days of healthy rainfall in the latter third of the month.

The overall average temperature for the month in Thornton was 54.4 degrees.  Out at Denver International Airport where Denver’s official readings are taken, the average was a good bit warmer at 56.5 degrees.  The 30 year historical average for October is 50.9 degrees so both locations were considerably warmer than normal.

Temperatures in Thornton ranged from a maximum of 86.8 degrees on the 11th down to 30.5 degrees on the morning of the 28th.  Denver’s high and low came on the same dates at 87 degrees and 28 degrees respectively.  The high reading on the 11th was a record high for the date.

In terms of precipitation, 1.54 inches fell in Thornton’s rain bucket.  Denver bested us with 1.76 inches.  Both beat the October average of 1.02 inches.

Snowfall was non-existent during the month.  On average the Mile High City sees 4.0 inches of the white stuff in October.

Click here to view Thornton’s October 2015 climate report.

Thornton, Colorado's October 2015 temperatur?e summary.
Thornton, Colorado’s October 2015 temperatur?e summary.
Thornton, Colorado's October 2015 precipitation summary.
Thornton, Colorado’s October 2015 precipitation summary.

From the National Weather Service:

CLIMATE REPORT
NATIONAL WEATHER SERVICE BOULDER, CO
315 PM MST SUN NOV 1 2015

................................... 

...THE DENVER CO CLIMATE SUMMARY FOR THE MONTH OF OCTOBER 2015... 

CLIMATE NORMAL PERIOD 1981 TO 2010
CLIMATE RECORD PERIOD 1872 TO 2015

WEATHER         OBSERVED          NORMAL  DEPART  LAST YEAR`S
                 VALUE   DATE(S)  VALUE   FROM    VALUE  DATE(S)
                                          NORMAL
................................................................ 
TEMPERATURE (F)
RECORD
 HIGH              90   10/01/1892
 LOW               -2   10/29/1917
HIGHEST            87   10/11        83       4       83  10/15
LOWEST             28   10/28        22       6       29  10/27
AVG. MAXIMUM     70.1              65.3     4.8     69.5
AVG. MINIMUM     42.8              36.6     6.2     40.7
MEAN             56.5              50.9     5.6     55.1
DAYS MAX >= 90      0               0.0     0.0        0
DAYS MAX <= 32      0               0.4    -0.4        0
DAYS MIN <= 32      1               8.5    -7.5        4
DAYS MIN <= 0 0 0.0 0.0 0 
PRECIPITATION (INCHES) 
RECORD
 MAXIMUM 4.17 1969
 MINIMUM T 1934 
TOTALS 1.76 1.02 0.74 0.52 
DAILY AVG. 0.06 0.03 0.03 0.02 
DAYS >= .01         6               5.3     0.7        5
DAYS >= .10         3               2.4     0.6        2
DAYS >= .50         2               0.5     1.5        0
DAYS >= 1.00        0               0.1    -0.1        0
GREATEST
 24 HR. TOTAL    0.87   10/20 TO 10/21

SNOWFALL (INCHES)
 TOTAL            0.0               4.0
RECORD OCTOBER   31.2                                   1969

DEGREE_DAYS
HEATING TOTAL     274               440    -166      299
 SINCE 7/1        301               581    -280      394
COOLING TOTAL      16                 5      11        0
 SINCE 1/1        877               769     108      701

FREEZE DATES
RECORD
 EARLIEST     09/08/1962
 LATEST       06/08/2007
EARLIEST      10/28             10/07
LATEST                          05/05
.................................................. 

WIND (MPH)
AVERAGE WIND SPEED              8.8
RESULTANT WIND SPEED/DIRECTION   2/203
HIGHEST WIND SPEED/DIRECTION    29/010    DATE  10/27
HIGHEST GUST SPEED/DIRECTION    40/160    DATE  10/02

SKY COVER
POSSIBLE SUNSHINE (PERCENT)   MM
AVERAGE SKY COVER           0.60
NUMBER OF DAYS FAIR            6
NUMBER OF DAYS PC             15
NUMBER OF DAYS CLOUDY         10

AVERAGE RH (PERCENT)     53

WEATHER CONDITIONS. NUMBER OF DAYS WITH
THUNDERSTORM              2     MIXED PRECIP               0
HEAVY RAIN                0     RAIN                       3
LIGHT RAIN                6     FREEZING RAIN              0
LT FREEZING RAIN          0     HAIL                       0
HEAVY SNOW                0     SNOW                       0
LIGHT SNOW                0     SLEET                      0
FOG                       9     FOG W/VIS <= 1/4 MILE      3
HAZE                      6

-  INDICATES NEGATIVE NUMBERS.
R  INDICATES RECORD WAS SET OR TIED.
MM INDICATES DATA IS MISSING.
T  INDICATES TRACE AMOUNT.

November preview: Second snowiest month can bring a lot of variety

Thornton's November weather previewThe weather during the month of November in Denver metro area can offer just about anything.  While it is normally a quiet month, it can be prone to extremes.

November is Denver’s second snowiest month and major snowstorms are not entirely uncommon.  However conditions can also be quite dry.

Temperatures during the month continue to cool as we get closer to winter and by the end of the month the low temperatures routinely dip to 20 degrees or below.  At times it can in fact bring conditions more like what we see in January.

Get all the details on November’s weather and what we can expect in our complete preview here.

NOAA Winter Outlook: Little clarity as to El Niño’s impact on Thornton

Temperature - U.S. Winter Outlook: 2015-2016.  Click for larger view. (NOAA)
Temperature – U.S. Winter Outlook: 2015-2016. Click for larger view. (NOAA)

NOAA’s Climate Prediction Center released their 2015-2016 winter outlook this morning and while a strong El Niño will play a factor in some parts of the nation, its effects here are less clear.

As we have written about before, Colorado’s geographical location well inland, shelters it some from the effects of warm, Pacific waters.   Overall snowfall in Colorado during El Niño years has not trended greatly one way or another.  We have however seen some of our largest storms during El Niño.

NOAA’s outlook shows a pretty typical El Niño situation with some locations of the nation expected to receive copious amounts of moisture.  For us, it does point to a bit better chance of a wetter than normal period from December to February.

Read the complete text of NOAA’s outlook below.  At the bottom is the video they released to accompany it.

From NOAA:

Precipitation - U.S. Winter Outlook: 2015-2016. Click for larger view. (NOAA)
Precipitation – U.S. Winter Outlook: 2015-2016. Click for larger view. (NOAA)

Forecasters at NOAA’s Climate Prediction Center issued the U.S. Winter Outlook today favoring cooler and wetter weather in Southern Tier states with above-average temperatures most likely in the West and across the Northern Tier. This year’s El Niño, among the strongest on record, is expected to influence weather and climate patterns this winter by impacting the position of the Pacific jet stream.

“A strong El Niño is in place and should exert a strong influence over our weather this winter,” said Mike Halpert, deputy director, NOAA’s Climate Prediction Center. “While temperature and precipitation impacts associated with El Niño are favored, El Niño is not the only player. Cold-air outbreaks and snow storms will likely occur at times this winter. However, the frequency, number and intensity of these events cannot be predicted on a seasonal timescale.”

Other factors that often play a role in the winter weather include the Arctic Oscillation, which influences the number of arctic air masses that penetrate into the South and nor’easters on the East Coast, and the Madden-Julian Oscillation, which can impact the number of heavy rain storms in the Pacific Northwest.

The 2015 U.S. Winter Outlook (December through February):

Precipitation Outlook:

  • Wetter-than-average conditions most likely in the Southern Tier of the United States, from central and southern California, across Texas, to Florida, and up the East Coast to southern New England. Above-average precipitation is also favored in southeastern Alaska.
  • Drier-than-average conditions most likely for Hawaii, central and western Alaska, parts of the Pacific Northwest and northern Rockies, and for areas near the Great Lakes and Ohio Valley.

Temperature Outlook:

  • Above-average temperatures are favored across much of the West and the northern half of the contiguous United States. Temperatures are also favored to be above-average in Alaska and much of Hawaii. Below-average temperatures are most likely in the southern Plains and Southeast.

Drought Outlook:

  • The U.S. Drought Outlook shows some improvement is likely in central and southern California by the end of January, but not drought removal. Additional statewide relief is possible during February and March. Drought removal is likely across large parts of the Southwest, while improvement or removal is also likely in the southern Plains. However, drought is likely to persist in the Pacific Northwest and northern Rockies, with drought development likely in Hawaii, parts of the northern Plains and in the northern Great Lakes region.

While it is good news that drought improvement is predicted for California, one season of above-average rain and snow is unlikely to remove four years of drought,” said Halpert. “California would need close to twice its normal rainfall to get out of drought and that’s unlikely.”

This seasonal outlook does not project where and when snowstorms may hit or provide total seasonal snowfall accumulations. Snow forecasts are dependent upon the strength and track of winter storms, which are generally not predictable more than a week in advance.

NOAA produces seasonal outlooks to help communities prepare for what’s likely to come in the next few months and minimize weather’s impacts on lives and livelihoods. Empowering people with actionable forecasts and winter weather tips is key to NOAA’s effort to build a Weather-Ready Nation.

NOAA’s mission is to understand and predict changes in the Earth’s environment, from the depths of the ocean to the surface of the sun, and to conserve and manage our coastal and marine resources. Join us on Facebook, Twitter, Instagram and our other social media channels.