Category Archives: Climatology

Study: Mountain Monitoring System Artificially Inflates Temperature Increases at Higher Elevations

Warming mountain climate?  A new study raises serious questions about the accuracy of the data. (Tony's Takes)
Warming mountain climate? A new study raises serious questions about the accuracy of the data. (Tony’s Takes)

We have all heard the warnings about a warming climate and scientists have claimed to have the data to prove it.  However time and time again the very underlying data has been shown to be faulty.  Here we again find another case.

A new study from the University of Montana shows extreme warming bias in temperature data from critical networks.  The study takes a hard look at climate data gathered across the Rocky Mountain west, including here in Colorado.

“In the context of a warming climate, this artificial amplification of mountain climate trends has likely compromised our ability to accurately attribute climate change impacts across the mountainous western US,” author Jared Oyler writes in his study.

From the University of Montana:

January 12, 2015

MISSOULA – In a recent study, University of Montana and Montana Climate Office researcher Jared Oyler found that while the western U.S. has warmed, recently observed warming in the mountains of the western U.S. likely is not as large as previously supposed.

His results, published Jan. 9 in the journal Geophysical Research Letters, show that sensor changes have significantly biased temperature observations from the Snowpack Telemetry (SNOTEL) station network.

More than 700 SNOTEL sites monitor temperature and snowpack across the mountainous western U.S. SNOTEL provides critical data for water supply forecasts. Researchers often use SNOTEL data to study mountain climate trends and impacts to mountain hydrology and ecology.

Oyler and his co-authors applied statistical techniques to account for biases introduced when equipment was switched at SNOTEL sites in the mid-1990s to mid-2000s. His revised datasets reduced the biases to reveal that high-elevation minimum temperatures were warming only slightly more than minimum temperatures at lower elevations.

“Observations from other station networks clearly show that the western U.S. has experienced regional warming,” Oyler said, “but to assess current and future climate change impacts to snowpack and important mountain ecosystem processes, we need accurate observations from the high elevation areas only covered by the SNOTEL network. The SNOTEL bias has likely compromised our ability to understand the unique drivers and impacts of climate change in western U.S. mountains.”

Co-authors on the paper “Artificial Amplification of Warming Trends Across the Mountains of the Western United States” include UM researchers Solomon Dobrowski, Ashley Ballantyne, Anna Klene and Steve Running. It is available online at http://onlinelibrary.wiley.com/enhanced/doi/10.1002/2014GL062803/.

###

Contact: Jared Oyler, Montana Climate Office, 215-260-4487, jared.oyler@ntsg.umt.edu.

On the net:  Study: US Weather Stations Exaggerated Warming In Western Mountains
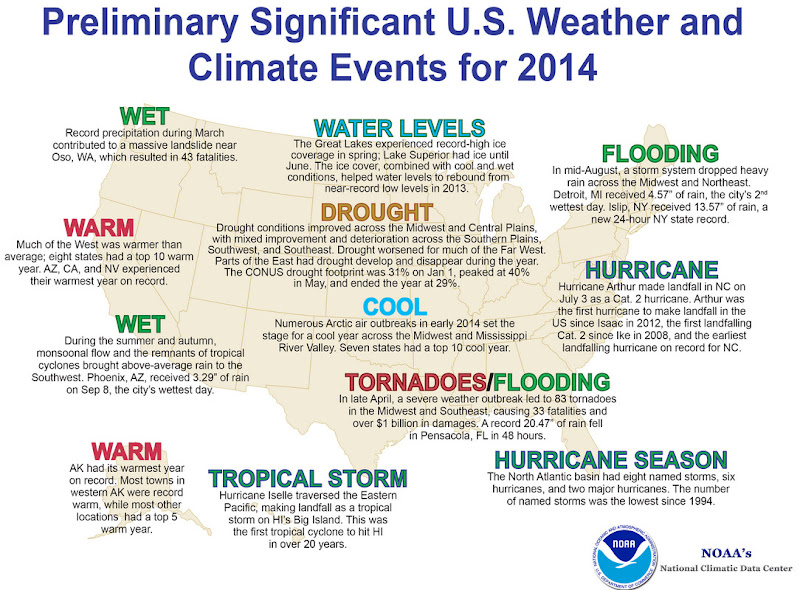
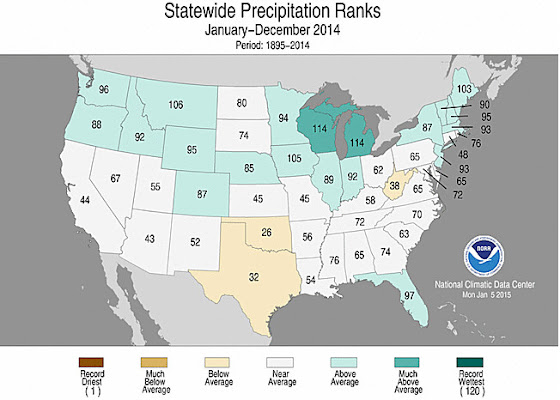
State of the Climate 2014: Warmer, wetter than normal in the U.S.

Significant U.S. Weather and Climate Events for 2014. Click for larger view.  (NOAA / NCDC)
Significant U.S. Weather and Climate Events for 2014. Click for larger view. (NOAA / NCDC)

The National Climatic Data Center (NCDC) has released its summary of the nation’s climate and weather for 2014.  Its analysis shows that overall, the United States experienced warmer than normal temperatures and above average precipitation.

From NOAA / NCDC:

2014 U.S. temperature exceeds 20th-century average for the 18th consecutive year

Second warmest December boosted 2014 to 34th warmest year for contiguous U.S; eight weather and climate disasters exceeded $1 billion in damages

The 2014 annual average contiguous U.S. temperature was 52.6°F, 0.5°F above the 20th century average. Very warm conditions dominated the West, with four states having their warmest year on record, while the Midwest and Mississippi Valley were cool. This ranked as the 34th warmest year since we began keeping track in the 1895, while the temperature exceeded the 20th Century average for the 18th consecutive year.

The average contiguous U.S. precipitation was 30.76 inches, 0.82 inch above average, and ranked as the 40th wettest year in the 120-year period of record. The Northern U.S. was wet, and the Southern Plains were dry; the national drought footprint shrank about 2 percent.

In 2014, there were eight weather/climate disaster events with losses exceeding $1 billion each across the United States. These eight events resulted in the deaths of 53 people. The events include: the western U.S. drought, the Michigan & Northeast flooding event, five severe storm events, and one winter storm event.

U.S. climate highlights: 2014

  • The West was warmer than average for much of 2014. Nine states had a top 10 warm year.Alaska, Arizona, California, and Nevada each had their warmest year on record. Most locations from the Rockies to the East Coast were cooler than average, with the exception of New England and Florida. Seven states across the Midwest and Mississippi River Valley had a top 10 cool year. No state was record cold during 2014.
  • The Pacific Northwest, Northern Rockies, Midwest, and Northeast were all wetter than average. Michigan and Wisconsin each had their seventh wettest year on record. The Southern Plains and parts of the Ohio Valley were drier than average, but no state was top 10 dry. The rest of the contiguous U.S. had near-average annual precipitation totals.
  • The U.S. Climate Extremes Index (USCEI) for 2014 was 35 percent above average, ranking as the 19th highest annual USCEI in the 105-year record. The components of the USCEI that were much above average for the year included warm nighttime temperatures and 1-day precipitation totals. The USCEI is an index that tracks extremes (falling in the upper or lower 10 percent of the record) in temperature, precipitation, drought, and land-falling tropical cyclones across the contiguous U.S.
Statewide Average Temperature Ranks for 2014. (NOAA / NCDC)
Statewide Average Precipitation Ranks for 2014. (NOAA / NCDC)

2014 Thornton annual weather recap: Annual temps near normal, above average precipitation

2014 has come to a close and as we look back on the year, we can see that it was a relatively average year lacking too much drama.

In terms of temperatures, Thornton saw an average overall annual temperature of 49.4 degrees.  Out at Denver International Airport where the Mile High City’s official records are kept, the average was warmer at 50.5 degrees.  By comparison, Denver’s 1981 to 2010 annual average temperature is 50.4 degrees.

Thornton recorded 29 days of high temperature readings at or above 90 degrees.  On average Denver sees 40 of them.  Denver matched our number with 29 as well.

The hottest reading of the year was 98.2 degrees which came on July 7.  Denver’s highest reading of 100 degrees came on the same date.

At the other end of the spectrum, our coldest temperature was -12.6 degrees on February 5th.  Denver bested us with two -19 degree readings, one on February 5th and another on December 30th.

In all, Thornton saw 155 days with readings below freezing.  Denver recorded 150.  Both were near the average of 156.9 days.

Precipitation for 2014 came in a good ways above average, largely due to a wet May and July.  Thornton took 19.54 inches into the rain bucket while Denver received slightly less with 18.77 inches.  Both were well above the annual average of 14.30 inches.

Snowfall for the calendar year lagged behind average in both Thornton and Denver.  Thornton saw 46.2 inches of the white stuff, Denver a nearly identical 46.3 inches.  On average we expect to see 53.8 inches.

Click here to view Thornton’s 2014 climate summary report.

Thornton, Colorado 2014 Annual Temperature Summary.
Thornton, Colorado 2014 Annual Precipitation Summary.

From the National Weather Service:

CLIMATE REPORT
NATIONAL WEATHER SERVICE BOULDER, CO
200 AM MST THU JAN 1 2015

...................................

...THE DENVER CO CLIMATE SUMMARY FOR THE YEAR OF 2014...

CLIMATE NORMAL PERIOD 1981 TO 2010
CLIMATE RECORD PERIOD 1872 TO 2014

WEATHER         OBSERVED          NORMAL  DEPART  LAST YEAR`S
                 VALUE   DATE(S)  VALUE   FROM    VALUE  DATE(S)
                                          NORMAL
................................................................
TEMPERATURE (F)
RECORD
 HIGH             105   06/26/2012
                        06/25/2012
                        07/20/2005
                        08/08/1878
 LOW              -29   01/09/1875
HIGHEST           100   07/07        64      36      100  07/11
                                                          06/11
LOWEST            -19   12/30        36     -55      -15  12/05
                        02/05
AVG. MAXIMUM     64.6              64.7    -0.1     63.9
AVG. MINIMUM     36.5              36.3     0.2     36.3
MEAN             50.5              50.5     0.0     50.1
DAYS MAX >= 90     29              39.6   -10.6       54
DAYS MAX <= 32     24              20.0     4.0       29
DAYS MIN <= 32    150             156.9    -6.9      169
DAYS MIN <= 0      14               5.8     8.2       11

PRECIPITATION (INCHES)
RECORD
 MAXIMUM        23.31   1967
 MINIMUM         7.29   2008
TOTALS          18.77             14.30    4.47    17.60
DAILY AVG.       0.05              0.03    0.02     0.05
DAYS >= .01        98              79.7    18.3       82
DAYS >= .10        44              34.9     9.1       42
DAYS >= .50        10               7.6     2.4        8
DAYS >= 1.00        4               2.3     1.7        3
GREATEST
 24 HR. TOTAL    2.85   07/29 TO 07/30             09/13 TO 09/14

 STORM TOTAL       2.93                             4.65
 (MM/DD(HH))      07/29(00) TO 07/30(00)   09/09(00) TO 09/15(00)

SNOWFALL (INCHES)
RECORDS
 TOTAL          115.9   1913
                        0
                        0
 24 HR TOTAL     23.6   12/24/1982 TO 12/24/1982
 SNOW DEPTH        MM   MM
TOTALS           46.3              53.8    -7.5     72.1
 LIQUID EQUIV     MM                MM      MM       MM
SINCE 7/1        16.0              22.5    -6.5      8.1
 LIQUID 7/1       MM                MM      MM       MM
SNOWDEPTH AVG.      0                MM      MM        0
DAYS >= TRACE      55              33.3    21.7       60
DAYS >= 1.0        17              16.3     0.7       20
GREATEST
 SNOW DEPTH         6   12/31                          9  02/25
                        12/30
 24 HR TOTAL      5.4   12/29                    02/24 TO 02/24

 STORM TOTAL      5.9                               11.7
 (MM/DD(HH))      12/29(00) 12/30(00)        03/22(00) TO 03/24(00)

DEGREE_DAYS
HEATING TOTAL    5844              6059    -215     6302
 SINCE 7/1       2291              2468    -207     2451
COOLING TOTAL     701               769     -68      999
 SINCE 1/1        701               769     -68      999

FREEZE DATES
RECORD
 EARLIEST     09/08/1962
 LATEST       06/08/2007
EARLIEST                        10/07
LATEST                          05/05
.....................................................

WIND (MPH)
AVERAGE WIND SPEED              10.2
RESULTANT WIND SPEED/DIRECTION   2/214
HIGHEST WIND SPEED/DIRECTION    51/310    DATE  07/11
HIGHEST GUST SPEED/DIRECTION    66/340    DATE  04/29

SKY COVER
POSSIBLE SUNSHINE (PERCENT)   MM
AVERAGE SKY COVER           0.60
NUMBER OF DAYS FAIR           72
NUMBER OF DAYS PC            226
NUMBER OF DAYS CLOUDY         67

AVERAGE RH (PERCENT)     54

WEATHER CONDITIONS. NUMBER OF DAYS WITH
THUNDERSTORM              0     MIXED PRECIP               1
HEAVY RAIN               15     RAIN                      35
LIGHT RAIN               91     FREEZING RAIN              0
LT FREEZING RAIN          2     HAIL                       6
HEAVY SNOW                6     SNOW                      24
LIGHT SNOW               56     SLEET                      1
FOG                     115     FOG W/VIS <= 1/4 MILE     32
HAZE                     57

-  INDICATES NEGATIVE NUMBERS.
R  INDICATES RECORD WAS SET OR TIED.
MM INDICATES DATA IS MISSING.
T  INDICATES TRACE AMOUNT.

December 2014 weather recap: Temperatures near normal, a bit more than average snow

The month of December started out quiet and quite dry.  Those mild days however gave way to much colder temperatures during the latter half as well as some nice shots of snow.

For the first 13 days of December 2014, Thornton and the Denver area saw temperatures above normal for the most part.  Conditions were dry and calm.  On the 14th, our first storm system came in and delivered a quick, light snowfall.

We then entered a calm period that lasted up until Christmas.  Temperatures got much colder and some cold temperatures records fell.  We also recorded snow on five out of the last seven days of the month.

It was a white Christmas although it wasn’t until late in the day that the white stuff began falling.  Denver’s 3.4 inches on the 25th made it the third snowiest Christmas Day on record.  Thornton recorded 3.1 inches on the day.

The average temperature for the month in Thornton was 29.2 degrees.  Out at the airport, Denver’s official average was a good bit higher at 31.2 degrees.  The long term December average is 30.0 degrees.

Thornton’s temperatures ranged from a high of 64.0 degrees on the 12th down to a bone chilling low of -12.1 degrees on the 30th.  Denver saw a high mark of 66 degrees and a low of -19 degrees on those days.

Two temperature records were set during the month, both on December 30.  A new record low maximum for the date of 1 degree was recorded (old record was 8 degrees set in 1915).  Additionally, Denver’s -19 degrees that day was a new record low (old record was -11 degrees set in 1898).

In terms of precipitation, Thornton recorded 0.48 inches of liquid precipitation.  Denver was a bit wetter with 0.59 inches.  Both readings were above Denver’s December average of 0.35 inches.

On average the Mile High City records 8.5 inches of snowfall during December.  In 2014 the month brought 8.8 inches to Thornton while at the airport Denver recorded 12.0 inches.

Click here to view Thornton’s December 2014 climate report.

Thornton, Colorado December 2014 Temperature Summary.
Thornton, Colorado December 2014 Precipitation Summary.

From the National Weather Service:

CLIMATE REPORT
NATIONAL WEATHER SERVICE BOULDER, CO
1041 PM MST THU JAN 1 2015
 
...................................
 
...THE DENVER CO CLIMATE SUMMARY FOR THE MONTH OF DECEMBER 2014...
 
CLIMATE NORMAL PERIOD 1981 TO 2010
CLIMATE RECORD PERIOD 1872 TO 2014
 
WEATHER         OBSERVED          NORMAL  DEPART  LAST YEAR`S
                 VALUE   DATE(S)  VALUE   FROM    VALUE  DATE(S)
                                          NORMAL
................................................................
TEMPERATURE (F)
RECORD
 HIGH              79   12/05/1939
 LOW              -25   12/22/1990
                        12/24/1876
HIGHEST            66   12/12        62       4       68  12/18
LOWEST            -19   12/30        -4     -13      -15  12/05
AVG. MAXIMUM     44.1              42.8     1.3     42.9
AVG. MINIMUM     18.5              17.1     1.4     14.0
MEAN             31.3              30.0     1.3     28.4
DAYS MAX >= 90      0               0.0     0.0        0
DAYS MAX <= 32      5               5.8    -0.8        8
DAYS MIN <= 32     31              29.4     1.6       29
DAYS MIN <= 0       2               2.0     0.0        6   
PRECIPITATION (INCHES) 
RECORD
  MAXIMUM         5.21   1913
  MINIMUM         0.00   1881 
TOTALS           0.59              0.35    0.24     0.25 
DAILY AVG.       0.02              0.01    0.01     0.01 
DAYS >= .01         7               4.1     2.9        7
DAYS >= .10         2               1.1     0.9        1
DAYS >= .50         0               0.1    -0.1        0
DAYS >= 1.00        0               0.0     0.0        0
GREATEST
 24 HR. TOTAL    0.18   12/29 TO 12/30           12/03 TO 12/04
 
SNOWFALL (INCHES)
RECORDS
 TOTAL           57.4   1913
TOTALS           12.0               8.5
 
DEGREE_DAYS
HEATING TOTAL    1037              1086     -49     1128
 SINCE 7/1       2291              2468    -177     2451
COOLING TOTAL       0                 0       0        0
 SINCE 1/1        701               769     -68      999
 
FREEZE DATES
RECORD
 EARLIEST     09/08/1962
 LATEST       06/08/2007
EARLIEST                        10/07
LATEST                          05/05
.....................................................
 
WIND (MPH)
AVERAGE WIND SPEED              8.7
RESULTANT WIND SPEED/DIRECTION   2/218
HIGHEST WIND SPEED/DIRECTION    41/340    DATE  12/23
HIGHEST GUST SPEED/DIRECTION    52/330    DATE  12/23
 
SKY COVER
POSSIBLE SUNSHINE (PERCENT)   MM
AVERAGE SKY COVER           0.60
NUMBER OF DAYS FAIR            4
NUMBER OF DAYS PC             19
NUMBER OF DAYS CLOUDY          8
 
AVERAGE RH (PERCENT)     59
 
WEATHER CONDITIONS. NUMBER OF DAYS WITH
THUNDERSTORM              0     MIXED PRECIP               0
HEAVY RAIN                0     RAIN                       1
LIGHT RAIN                1     FREEZING RAIN              0
LT FREEZING RAIN          0     HAIL                       0
HEAVY SNOW                1     SNOW                       4
LIGHT SNOW                8     SLEET                      0
FOG                      12     FOG W/VIS <= 1/4 MILE      3
HAZE                      4
 
-  INDICATES NEGATIVE NUMBERS.
R  INDICATES RECORD WAS SET OR TIED.
MM INDICATES DATA IS MISSING.
T  INDICATES TRACE AMOUNT.

White Christmas in Denver? Snow on the holiday not particularly common

For many, the holiday season isn’t complete without a chill in the air and snow on the ground. Here in Denver we historically enjoy a better chance of experiencing the proverbial white Christmas than many places in the nation.

However, how the Mile High City fares in experiencing a white Christmas does depend on your definition of one.

If it means having actual snowfall on Christmas Day the chances aren’t that good. But, if simply having snow on the ground suffices, the chances improve considerably.

For a complete look at Denver’s Christmas weather statistics, click here.

For the latest Thornton weather forecast for Christmas, check out our forecast page.

Historical probability of a white Christmas (at least 1" of snow on the ground).  NOAA / NCDC
Historical probability of a white Christmas (at least 1″ of snow on the ground). NOAA / NCDC

November 2014 weather recap: Month saw cooler, drier than normal conditions

The month of November this year was one that saw some widely varying temperatures from comfortable fall readings to bone chilling cold.  Precipitation ran light and while we saw our first measurable snows for the season, it was still dry.

With a high pressure ridge above, the month started out quite nice.  A cold front moved through on the third and not only cooled things down, but also brought the bulk of our precipitation for the month in the form of rain.

We then saw a week of unseasonably warm conditions that lasted through the 10th.  After that, the bottom fell out and the mercury plunged.  Five of the next six days failed to climb above freezing as bone-chilling cold more akin to January was seen.  We did manage to record more than two inches of snow over the same period.

A largely seasonal weather pattern then settled in with most of the next nine days having readings not too far from average.  Three of the last four days of the month then brought back very mild conditions.

Thornton’s overall average temperature for the month was 35.1 degrees.  This was well below the long term November average for Denver of 38.3 degrees.  Out at the airport, official Denver readings were a bit warmer with an average of 36.2 degrees.

Thornton’s warmest reading in November came on the 29th with maximum of 72.5 degrees.  The coldest was -8.8 degrees on the morning of the 13th.  Denver’s maximum was similar to ours at 72 degrees but its coldest was a bit further down there at -14 degrees.

Five temperature records were set for the month, only one was for a warm reading.  That came on the 9th with a record high minimum.

On the other hand, demonstrating just how significant the cold blast in the middle of the month was, Denver set four cold temperature related records for the month.  These included record low maximums on the 11th and 12th and record lows on the 12th and 13th.

In terms of precipitation, Thornton finished below average while Denver was slightly above.  The November average is 0.61 inches.  Here in Thornton we had a mere 0.39 inches while DIA recorded 0.76.

November is one of our snowiest months but that was certainly not the case this year.  While the long term average is 8.7 inches, Thornton recorded only 3.0 inches and Denver 4.0 inches.

Click here to view Thornton’s November 2014 climate report.

November 2014 temperature summary for Thornton, Colorado. (ThorntonWeather.com)
November 2014 precipitation summary for Thornton, Colorado. (ThorntonWeather.com)

From the National Weather Service:

CLIMATE REPORT
NATIONAL WEATHER SERVICE BOULDER, CO
144 AM MST MON DEC 1 2014

...................................

...THE DENVER CO CLIMATE SUMMARY FOR THE MONTH OF NOVEMBER 2014...

CLIMATE NORMAL PERIOD 1981 TO 2010
CLIMATE RECORD PERIOD 1872 TO 2014

WEATHER         OBSERVED          NORMAL  DEPART  LAST YEAR`S
                 VALUE   DATE(S)  VALUE   FROM    VALUE  DATE(S)
                                          NORMAL
................................................................
TEMPERATURE (F)
RECORD
 HIGH              80   11/08/2006
 LOW              -18   11/29/1877
HIGHEST            72   11/29        73       7       71  11/13
                        11/01
LOWEST            -14   11/13         6      -8       12  11/21
AVG. MAXIMUM     50.6              52.1    -1.5     55.1
AVG. MINIMUM     21.8              24.5    -2.7     26.7
MEAN             36.2              38.3    -2.1     40.9
DAYS MAX >= 90      0               0.0     0.0        0
DAYS MAX <= 32      5               2.3     2.7        2
DAYS MIN <= 32     22              23.4    -1.4       25
DAYS MIN <= 0       4               0.6     3.4        0 
PRECIPITATION (INCHES) 
RECORD 
 MAXIMUM         3.21   1946 
 MINIMUM            T   1899 
                        1901 
                        1949 
TOTALS           0.76              0.61    0.15     0.27 
DAILY AVG.       0.03              0.02    0.01     0.01 
DAYS >= .01         6               4.7     1.3        3
DAYS >= .10         3               1.6     1.4        1
DAYS >= .50         0               0.0     0.0        0
DAYS >= 1.00        0               0.0     0.0        0
GREATEST
 24 HR. TOTAL    0.30   11/03 TO 11/03           11/21 TO 11/21

SNOWFALL (INCHES)
RECORDS
 TOTAL           42.6   1946
TOTALS            4.0               8.7

DEGREE_DAYS
HEATING TOTAL     857               801      56      715
 SINCE 7/1       1254              1382    -128     1323
COOLING TOTAL       0                 0       0        0
 SINCE 1/1        701               769     -68      999

FREEZE DATES
RECORD
 EARLIEST     09/08/1962
 LATEST       06/08/2007
EARLIEST                        10/07
LATEST                          05/05
..................................................

WIND (MPH)
AVERAGE WIND SPEED              10.1
RESULTANT WIND SPEED/DIRECTION   3/228
HIGHEST WIND SPEED/DIRECTION    43/040    DATE  11/10
HIGHEST GUST SPEED/DIRECTION    54/040    DATE  11/10

SKY COVER
POSSIBLE SUNSHINE (PERCENT)   MM
AVERAGE SKY COVER           0.60
NUMBER OF DAYS FAIR            4
NUMBER OF DAYS PC             21
NUMBER OF DAYS CLOUDY          5

AVERAGE RH (PERCENT)     53

WEATHER CONDITIONS. NUMBER OF DAYS WITH
THUNDERSTORM              1     MIXED PRECIP               1
HEAVY RAIN                1     RAIN                       2
LIGHT RAIN                2     FREEZING RAIN              0
LT FREEZING RAIN          0     HAIL                       0
HEAVY SNOW                1     SNOW                       3
LIGHT SNOW                7     SLEET                      0
FOG                       8     FOG W/VIS <= 1/4 MILE      1
HAZE                      5

-  INDICATES NEGATIVE NUMBERS.
R  INDICATES RECORD WAS SET OR TIED.
MM INDICATES DATA IS MISSING.
T  INDICATES TRACE AMOUNT.

Thornton’s December weather preview: Arrival of winter can bring highly variable conditions

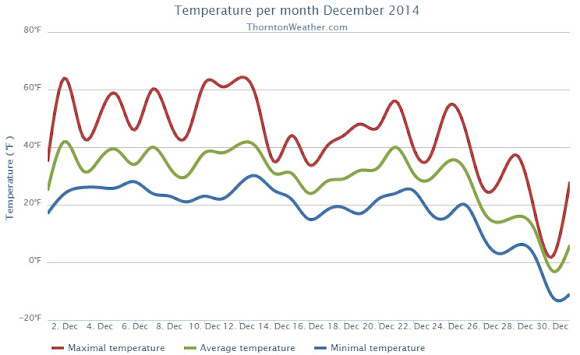
The month of December brings with it the official start of winter and oftentimes, colder and snowier weather conditions.  It however can also offer unseasonably warm temperatures and bone dry conditions.

Through November, the snow season along the Colorado Front Range has been dismal.  With a mere 4.0 inches of snow having been recorded in Denver (3.0 in Thornton), seasonal snowfall is 9.0 inches below normal.

December can prove to be a rebound month and help bolster those numbers.  However precipitation can be hit or miss as while monster snowstorms are possible, we have also seen starkly dry years.

Current long range forecasts point to a warm start to the month followed by seasonal conditions.

Get all the details on Thornton’s December weather including a look back at historical events and a look at the long range forecast in our December weather preview here.

Thanksgiving climatology: Comfortable temps, dry conditions the norm

Denver and Thornton's historical Thanksgiving weather.The holiday season is about to kick off with Thanksgiving and with many folks traveling in the coming weeks, the focus is oftentimes on the weather.  Looking back at Denver’s historical Thanksgiving weather, we see that the day is usually dry with comfortable temperatures.

Details on every Thanksgiving in Denver since recordkeeping began in 1872 is below.  While calm and dry may be the norm, that doesn’t mean that drama isn’t possible.

For this year, what can we expect?  At this time it all depends on which forecast model you want to believe.

The GFS indicates a cold front with temperatures in the 30s.  The ECMWF points to ridging which would lead to an unseasonably warm day.  Which would we side with?  For right now we prefer the ECMWF solution.

  • Stay up to date with Thornton’s weather: Be sure to ‘like’ us on Facebook, follow us on Twitter and add us to your Google+ circles.

From the National Weather Service – Thanksgiving climatology:

Average High: 49
Average Low: 24

Warmest: 73 (1909)
Coldest: -18 (1877)

Greatest Daily Snowfall: 8.5″ (1928)
Chance of Measurable Snow (>=0.1″): 12%

Year High Low Snowfall
2013 51 24
2012 58 23
2011 69 38
2010 40 4
2009 66 24
2008 44 25
2007 29 8 0.1
2006 63 30
2005 55 25
2004 60 33
2003 37 10
2002 59 22
2001 57 29
2000 42 26
1999 50 24
1998 72 35
1997 52 33 0.7
1996 58 27
1995 56 31
1994 58 29
1993 18 -5 T
1992 42 12
1991 33 27 T
1990 53 27
1989 58 21
1988 63 33
1987 30 24 5
1986 62 32
1985 39 13 T
1984 54 29
1983 48 18
1982 50 18
1981 38 11
1980 47 14
1979 36 11
1978 57 25
1977 54 30
1976 61 34
1975 39 15
1974 29 10 0.9
1973 42 20 T
1972 50 20
1971 60 24
1970 49 29 0.2
1969 47 13
1968 34 15 1.6
1967 48 27 T
1966 47 26
1965 57 31 T
1964 45 28
1963 48 19
1962 52 22
1961 51 26
1960 68 34
1959 28 12 0.5
1958 19 -4 4.8
1957 52 20 0.2
1956 52 22
1955 48 20
1954 68 35
1953 59 36
1952 21 -5
1951 53 24 T
1950 49 13 T
1949 66 56
1948 41 26
1947 48 29 0.6
1946 61 40
1945 39 15
1944 64 33
1943 38 19 4
1942 36 19
1941 34 17
1940 50 24
1939 56 35
1938 41 14
1937 53 32
1936 55 30
1935 54 36
1934 33 16 T
1933 45 33
1932 68 33
1931 28 12
1930 49 22
1929 59 24
1928 31 21 8.5
1927 59 30
1926 56 43
1925 50 30
1924 54 30
1923 50 24
1922 44 30 T
1921 56 30
1920 48 28
1919 -1 -5 0.6
1918 31 15
1917 51 35
1916 66 31
1915 44 29
1914 61 34
1913 51 28
1912 57 39
1911 52 24
1910 71 47
1909 73 34
1908 38 11
1907 46 25
1906 45 26
1905 32 10
1904 62 25
1903 63 30
1902 55 28
1901 72 29
1900 57 28
1899 47 36
1898 36 13
1897 37 22 2
1896 23 2 0.9
1895 50 29
1894 51 27
1893 58 26
1892 65 37
1891 59 35
1890 60 25
1889 28 21
1888 34 28 0.1
1887 43 21
1886 42 20
1885 52 32
1884 56 33
1883 68 34
1882 64 34
1881 47 17
1880 27 2
1879 30 17
1878 50 22
1877 16 -18
1876 27 3
1875 51 29
1874 62 25
1873 28 10
1872 56 22

November weather preview: A month that can bring just about anything

Thornton's November weather preview
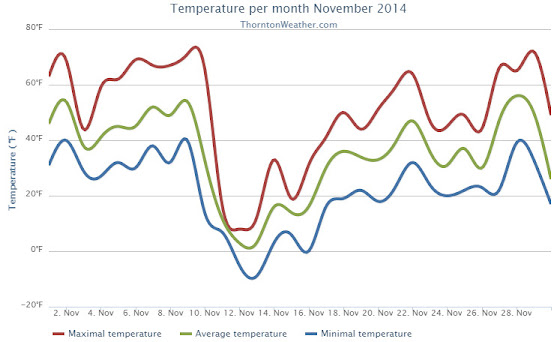
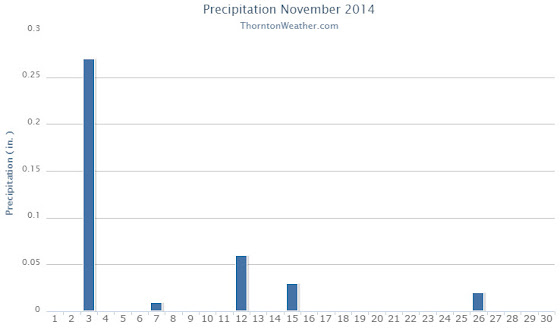
The weather during the month of November in Denver metro area can offer just about anything.  While it is normally a quiet month, it can be prone to extremes.

November is Denver’s second snowiest month and major snowstorms are not entirely uncommon.  However conditions can also be quite dry.

Temperatures during the month continue to cool as we get closer to winter and by the end of the month the low temperatures routinely dip to 20 degrees or below.  At times it can in fact bring conditions more like what we see in January.

Get all the details on November’s weather and what we can expect in our complete preview here.

Denver sets record high temperature for October 15

Record setting high temperatures in Thornton.As expected, temperatures in the Mile High City today were unseasonably warm and climbed to record-setting levels.  However, while Denver broke a high temperature record, Thornton fell quite a ways short.

Out at Denver International Airport, the mercury topped out at 83 degrees.  This bested the previous record high for the date of 82 degrees set in 2011 and previous years.

Here in Thornton, the cloud cover arrived earlier than the airport and impacted our readings.  We saw a maximum today of 77.9 degrees.

Across the board, temperature readings in the metro area were well above the average high of 66 degrees for the date.

  • Stay up to date with Thornton’s weather: Be sure to ‘like’ us on Facebook, follow us on Twitter and add us to your Google+ circles.